 Path Profile Settings
The Path Profile Settings button brings up a tabbed dialog to control various settings of the Path Profile.
Path Profile Settings can be accessed from the button found in the toolbar at the top of the path profile window or by right clicking in the workspace with the  Path Profile tool enabled.
Settings are split into 3 tabs:
Perpendicular/ Parallel Profile
General Settings
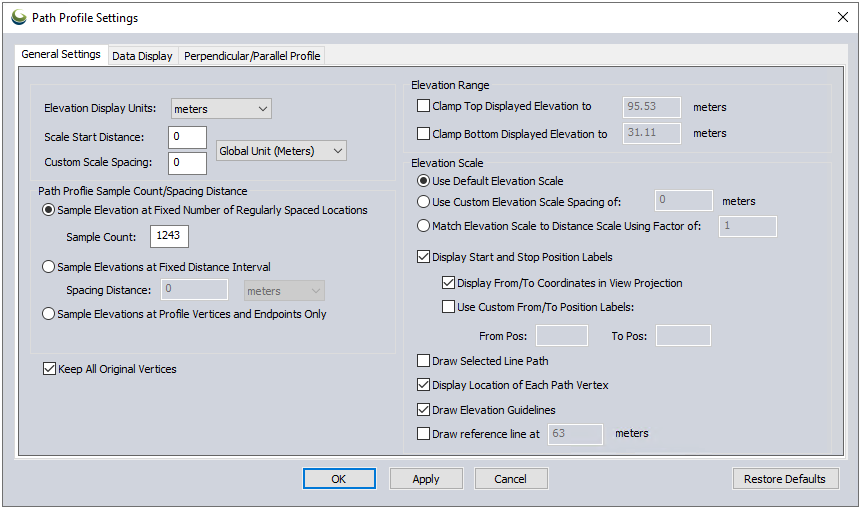
Elevation Display Units controls the units on the Path Profile elevation axis, as well as the other elevation settings used to control the elevation range in the path profile window.
Scale Start Distance determines the starting value of the x-axis (distance on the ground) of the Path Profile window. If set to 0, the distance will be determined automatically.
Custom Scale Spacing determines the spacing of the tick x-axis of the Path Profile window. Units in the drop down menu will change based on the path's distance relative to 1 km. Profiles smaller then 1 km can choose from units such as meters and feet, while profiles larger than 1 km will be able to choose between units such as kilometers and miles. If the Use Global Distance Unit option is chosen, or the profile line is shorter than the custom scale spacing, the spacing will revert to default Configuration settings for Distance Units. If set to 0, the distance will be determined automatically.
Path Profile Sample Count/Spacing Distance
The Path Profile displays the terrain based on elevation samples taken along the path; these settings determine how frequently the path is sampled. The maximum number of sample count value is 500K.
Sample Elevation at Fixed Number of Spaced Locations - Terrain elevation will be sampled a specified number of times along the path. Distance between samples is determined based on the Sample Count parameter and the length of the path.
Sample Elevations at Fixed Distance Interval - Terrain elevation will be sampled at this fixed distance along the path. Distance between samples is determined by the Spacing Distance Parameter.
Sample Elevations at Profile Vertices and Endpoints Only - The path will display elevations at the beginning and end of the line, as well as any additional vertices in the line. This creates a smooth, generalized path.
Elevation Range
Clamp Top Displayed Elevation to - This determines the maximum visible elevation value visible in the path profile viewer. The default maximum is determined automatically.
Clamp Bottom Displayed Elevation to - This determines the lowest elevation value visible in the path profile viewer. The default minimum is 0.
Elevation Scale
These options control the elevation values displayed on the vertical axis of the path profile window.
Use Default Elevation Scale - Enable this option to have Y axis spacing be determined automatically.
Use Custom Elevation Scale Spacing - This setting allows the user to specify the distance between lines on the Y-axis to a custom value. The value must be greater or equal to 0. If set to 0, the distance will be determined automatically.
Match Elevation Scale to Distance Scale - This option allows you to scale the Y-axis (the elevation values) to match the scale of the X-axis (distance on the ground). The Enter Vertical Exaggeration dialog allows you to determine the scale factor of the elevation values to the distance values.
DisplayStart and Stop Position Labels - This setting will indicate coordinates of the beginning and end of the profile line at the top of the profile graph. These will show as 'From Pos:' and 'To Pos:'
-
Display From/To Coordinate in Selected View Projection - This option will show coordinates of the path profile based on the display projection. This is set in the Configuration menu on the Projection Tab.
-
Use Custom From/To Position Labels - This option will add labels to be used in place of the coordinates. These will show as 'From text:' and 'To text:'
Draw Selected Line Path - When the path profile is generated from a 3D line feature, such as a flight line or pipeline, check this option to open each new profile path in a separate window instead of displaying it in the current one when a new profile line is drawn.
Example
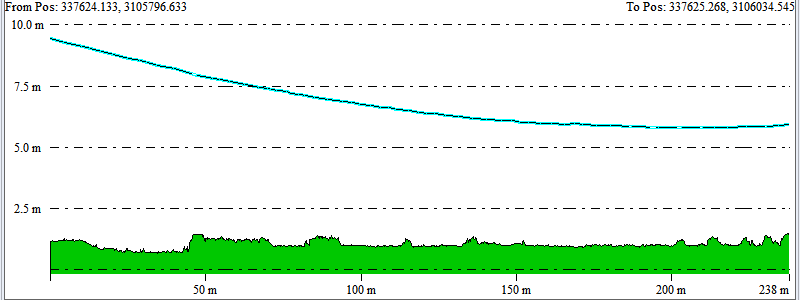
This example shows the path profile of a powerline with this setting enabled. Both the powerline and the terrain are shown on the profile view.
Display Location of Each Path Vertex - Shows the intermediate path vertices as yellow dots.
Draw Elevation Guide Lines - Turns on the dashed horizontal elevation guide lines.
Draw Reference Line at: Draws an additional guide line at your specified elevation. This value will default to the middle elevation of the current path if not set.
Data Display
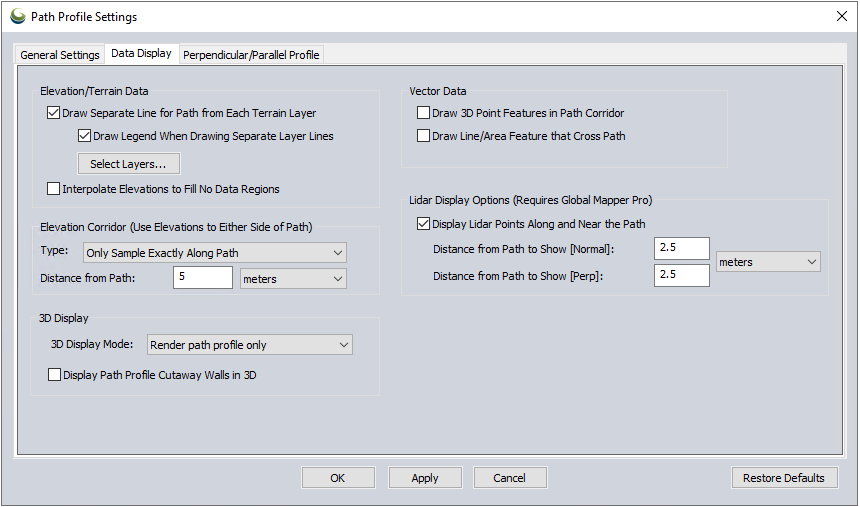
Elevation /Terrain Data
Draw Separate Line for Path from Each Terrain Layer - If there are multiple terrain layers loaded in the workspace, check this option to display a separate path profile for each terrain layer under the path (in addition to the main profile from the topmost layer at each location as before). Elevation Scale may also be set to match distance, and Interpolate Elevations to Fill No Data Regions may be disabled (it is on by default).
-
Draw Legend When Drawing Separate Layer Lines - Select this option to enable a legend when multiple terrain lines are drawn. This legend can be grabbed and dragged to place it around the path profile window. The terrain descriptions listed for the different layers are set by the Layer Description shown in the Control Center.
The line color for each terrain line can be set by right-clicking on the profile window and selecting Specify Style/ Color for Terrain Layer Line...
Interpolate Elevation to Fill No Data Regions - This option will interpolate the elevation values from known location on the path (linear interpolation) to fill in missing data. It will also draw straight lines at the edge of the data based on the last measured elevation value. Unchecking this option sets the unknown elevation values to minimum elevation values in the Path Profile for any location along the path that contains No Data. No-data areas will be replaced with the minimum elevation along the profile.
Example
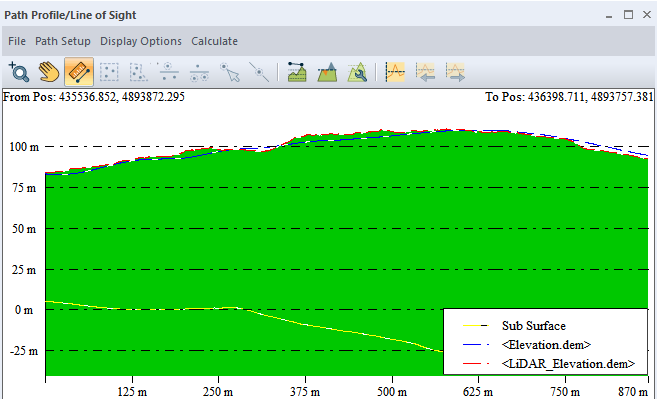
This example shows three separate terrain layers, with the legend placed at the bottom right. Left-click and drag to move the legend around the profile window. The legend lines are labels based on the terrain layers names as specified in the Control Center.
Elevation Corridor
The Elevation Corridor options
specify the elevation corridor width and
values used along the corridor (i.e. minimum, maximum, or average). If an elevation corridor is used, a dashed line will indicate the elevation exactly along the path of the profile line, while the regular red line with green fill will show the chosen sampling value (min., max., or avg.) along the elevation corridor. (These colors may also be customized from the right-click context menu).
The profile
corridor samples elevations along a line perpendicular to each sample
location, the length of which is set by the Distance from Path value in the options. The number of samples along the corridor is determined
so that it captures the full resolution of the available elevation layers.
Example
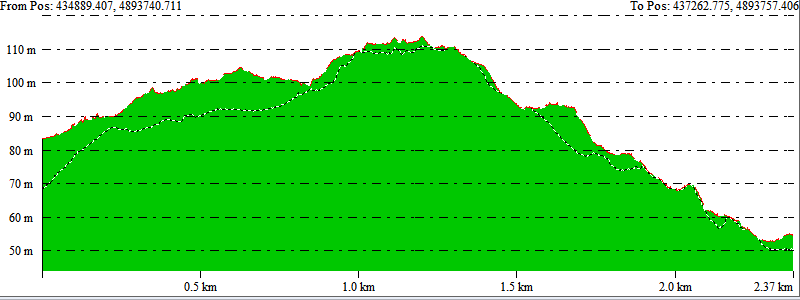
In this example, the elevation corridor type is set to Keep Maximum Elevation Along Perpendicular, and the Distance from path is set to a large distance of 500 meters. With a profile line drawn across this hill range, the red line and solid green fill show the mountain skyline (the maximum elevation) when looking across the terrain. The lower dashed grey line indicates the elevation specifically at along the path of the profile line.
3D Display Options
The 3D Display options can render a terrain cutaway in the 3D viewer. These settings allow for cutting a cross-section into the 3D terrain display and showing the profile graph. This can be done with either a single cutaway or a four-way cutaway. The four-way cutaway uses the Max. distance from Path in the Elevation Corridor settings above to build the width of the cutaway.
See more information on creating Path Profiles with 3D Cutaways here.
Display Path Profile Cutaway Walls in 3D - When an alternate 3D display option is selected, this setting will display the profile cutaway with a solid vertical wall. For more information see Path Profile with 3D Cutaway
Vector Data
Draw 3D Point Features in Path Corridor - Displays 3D point features, such as control points, that fall within the Path Profile width specified in the Lidar Display Options of the Path Profile Settings.
Note: When the “Draw 3D Point Features in Path Corridor” option is on, and the Elevation Corridor type is set to “Only Sample Exactly Along Path“, then the “Distance from Path to Show“ setting will be used to search for 3D points. This is required to display point features within the path profile.
Draw Line/ Area Features that Cross Path - Displays line and area features that cross the path as points with vertical lines. These features are colored based on their style in the Main Map. This can be controlled from the Layer Options in the Control Center.
Lidar Display Options
These settings require a Global Mapper Pro license. They allow for rendering Lidar/point cloud points within the Path Profile view and specifying a distance within which to include Lidar points near the path.
For more information, see Using the Path Profile Tool with Lidar/Point Cloud Data
Display Lidar Points Along and Near the Path - This option requires Global Mapper Pro. Checking this option will allow point cloud data to be displayed within the Path Profile view.
Distance from Path to Show - Specify the extent of surrounding points on each side of the line used to initiate the path profile which will be displayed. This setting can be toggled using increase and decrease corridor width buttons. 

Set Swath Increment - This value will determine the increment of adjustment that will be applied when using the increase and decrease corridor width buttons.
Parallel/Perpendicular Profile settings
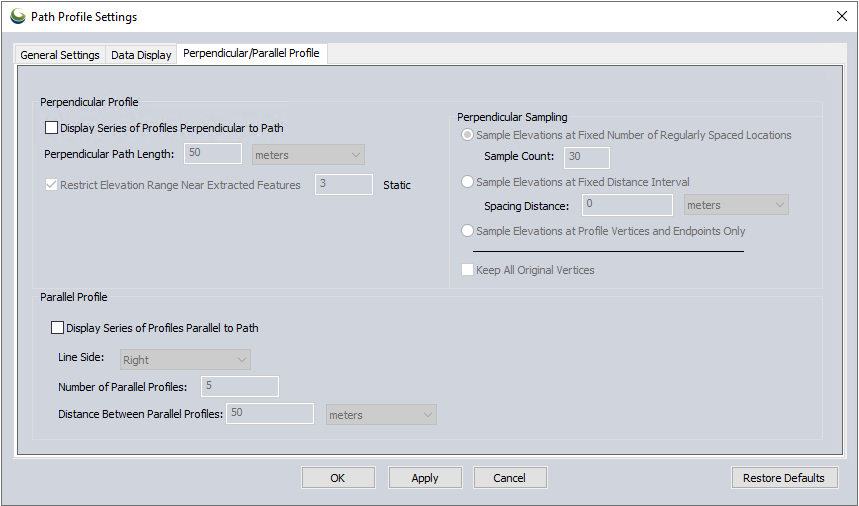
See: Parallel and Perpendicular Profiles
Restore Defaults
This button will restore the default values and settings for the dialog. This is useful for resetting the dialog.