 Calculate Color Statistics in Selected Areas
Color Statistics are helpful for image analysis workflows, and to determine the appropriate colors when vectorizing imagery with the Create Area Features from Equal Values tool.
Select the areas feature(s), then open this tool from one of multiple places:
- In the Digitizer Toolset, choose the icon in the Information section
- in the Digitizer context menu under Attribute/ Style Functions and Analysis/ Measurement.
If multiple image layers are loaded, the topmost layer will be used.
The calculation will come from the displayed pixel values of the data, including any changes from Color/ Contrast Adjustment, Color Grade Tab, or Band Setup Tab that have been applied to the layer.
Color Statistics Options: Similarity
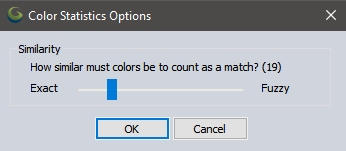
Use the slider to select how close colors must be to be declared a "match". When set to Exact (0), then the stored color values must match exactly. Any other value allows for slightly different colors to be considered the same. The usefulness of this depends on the type of data being analyzed. For example, when attempting to determine the roof color for building footprints, a non-zero similarity number is recommended, since many colors that look the same vary slightly in their internal representation.
Statistics
Global Mapper will add the following attributes to each feature:
MOST_PRESENT_COLOR - this is the RGB value that occurs the largest number of times within the area feature.
In the following attributes, the values are calculated separately for the Red, Green, and Blue components of the colors.
AVG_RGB - The average Red, Green, and Blue color values.
MODE_RGB - The mode (most frequent) Red, Green and Blue color values.
1ST_QUARTILE_RGB - The first quartile value.
MEDIAN_RGB - The median Red, Green and Blue color values.
3RD_QUARTILE_RGB - The 3rd quartile value.