Localized Density: Voronoi Density Sampling
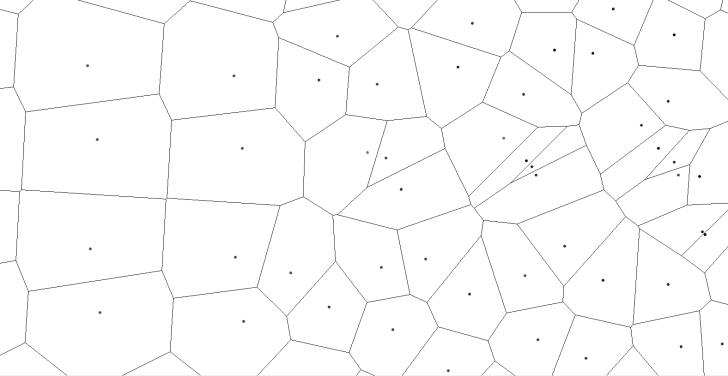
The Voronoi Horizontal Sampling Density tool uses irregular Thiessen polygons to calculate local point cloud density. By calculating individual point density using the area surrounding each point, this method produces more precise results than grid-based methods that count the number of points within a particular bin size.
The Localized Density tool can be found in the Lidar Analysis menu.
This tool generates three outputs: Density Grid, a binary Pass/Fail Raster, and a summary report.
The local density measurement (used to produce the Density Grid) and the Pass/Fail binary values can be added to the point cloud as attributes.
The Voronoi Density tool measures horizontal sampling density by creating Voronoi Cells (sometimes referred to as Thiessen polygons) around each point feature, then calculating the area of the polygons. Points with larger polygons have lower point density value. This density value is assigned as an attribute of each point. and then used to create the raster outputs.
Voronoi Density Sampling settings and options:
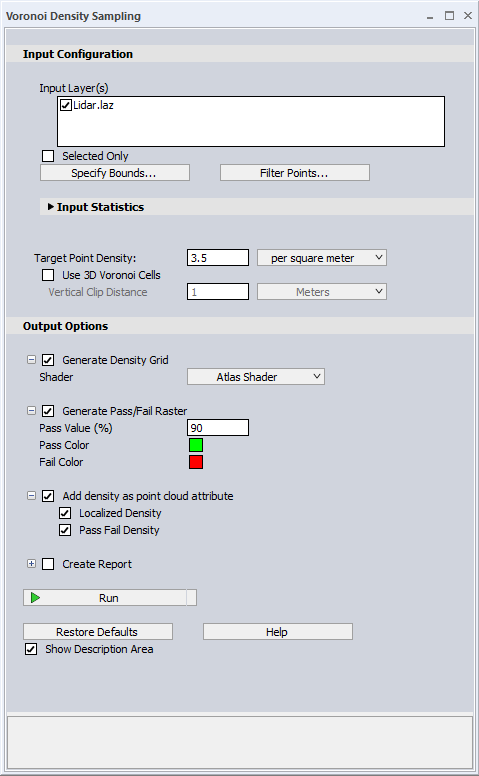
Input Configuration
- Input Layer - Choose which loaded layers will be operated on.
- Selected Only- Only the points currently selected by the Digitizer tool will be analyzed.
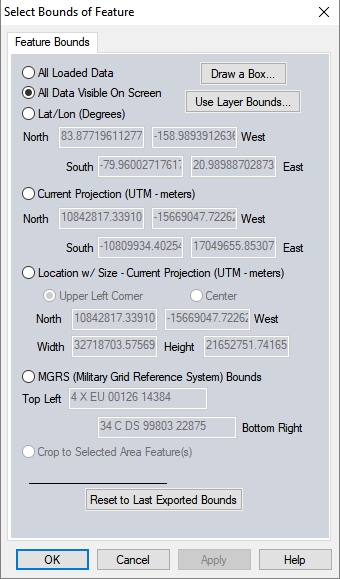
- Specify Bounds... - Set the bounds for the classification by drawing a box on the workspace, by using coordinate extents, or by cropping to a selected area feature.
- Filter Points... - Contains additional settings for filtering points based on elevation, classification, color values, Source ID, scan angle, etc.
Input Statistics
Displays total number of points being analyzed and a breakdown of counts of points by assigned classification. Additional Point Cloud Statistics can be found in the layer’s metadata.
Target Point Density
Enter the minimum point density value that would be considered acceptable. Use the dropdown to specify per square meter or square foot. This value serves as the nominal point spacing (NPS) reference for the analysis and will be used as the threshold for pass/fail assessment.
Use 3D Voronoi Cells
When this option is enabled, a three-dimensional spatial partitioning of the point cloud is performed. Rather than generating "flat" polygons based solely on X and Y coordinates, the tool constructs 3D Voronoi polyhedra around individual points. Local density is consequently calculated as a function of volume rather than area.
-
Vertical Clip Distance: Sets a maximum Z-axis boundary for 3D Voronoi cells, preventing them from expanding infinitely at the highest and lowest elevations of the point cloud. This prevents zero-density readings at the upper and lower vertical limits of the point cloud.
Output Options
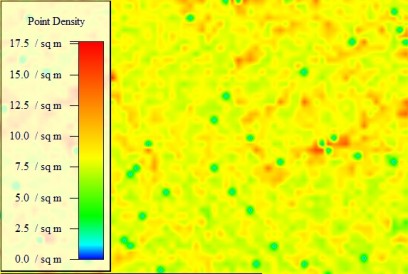
Generate Density Grid
Creates a raster grid where the value of each cell represents the mode (most frequent) density value of the points within it.
Shader - Shaders are the color ramp or color steps that are applied to visualize raster data values. Use this dropdown to select a shader to apply to the generated output raster. This shader will function independently from the workspace shader. After the layer is created, the shader can be changed in the Layer options.
Generate Pass/Fail Raster
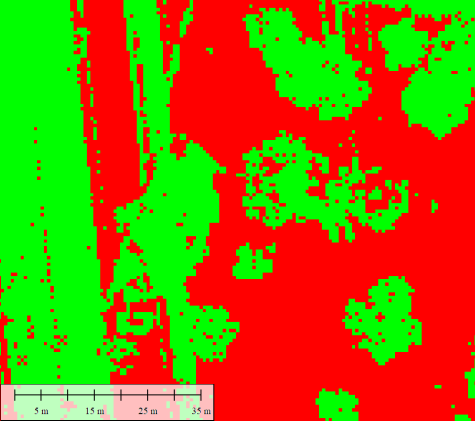
To identify areas that have a lower density than a specified threshold, use the Generate Pass/Fail raster option to create a binary raster grid.
Pass Value (% ) - Specify the required percentage of points within a cell that must meet the specified Target Point Density for the output grid cell to be assigned the "Pass" color.
Pass Color and Fail Color - Sets the colors used in the Pass/Fail raster visualization. By default, passing areas are shown in green and failing areas in red. Click on the color boxes to customize them.
Add density as point cloud attribute
These attributes are required to be present in the point cloud for creating the corresponding raster grid. They only need to be calculated once; they can be unchecked to be excluded from subsequent grid creation processes if desired.
Localized Density - Applies the calculated density value to each point in the point cloud as an attribute. Creates the attribute Localized Density (M) = points per square meter, calculated from the Voronoi polygons. Use the Color by Localized Density (points/m^2 Lidar Draw Mode option to visualize this attribute
Pass Fail Density - Applies a pass/fail status to each point based on the density assessment. Creates the attribute Pass/Fail Density: Binary attribute. 1 = Pass. 0 = Fail. Use the Color by Pass/Fail Density Lidar Draw Mode option to visualize this attribute.
Create Report
Check this option to save the summary report of the density calculations to your computer. The report will automatically open in your default browser. This file can also be saved through the browser options (ex. Print to PDF).
The report contains the following: Input Layers, Target Point Density, a Frequency Distribution of Calculated Point Densities chart, a Thematic Density Map and a Pass/Fail Map (if generated), along with the number and percent of Pass versus Fail cells.
Specify File Folder Location - Select a save location to save your Density Sample Report folders. A new folder (containing the necessary html and images) will be created in this directory upon each run of the tool.
Alternative methods for measuring point density in Global Mapper:
The Layer Metadata displays an estimated points per square meter based on the extent and number of points in the layer. While useful for a quick snapshot, it doesn’t measure areas of high or low density.
A quick way to visualize horizontal point density it is the Color by Point Density lidar draw option. This assigns a color to each point based on a local grid density measurement.