 Lidar/Terrain Display Controls
Lidar/Terrain Display Controls provides real-time, interactive filtering and visualization controls for point cloud and terrain data. This multifaceted dialog combines a variety of display settings from different sections of Global Mapper into one easy to use location. When enabled, the window will automatically open docked beneath the Control Center and can be pulled out for use as a floating window or docked elsewhere. The dialog will be blank when no compatible data (Lidar or terrain) is loaded.
Lidar/Terrain Display Controls is found on the Lidar Toolbar.
Lidar/Terrain Display Controls has 2 sections: Draw Mode and Point Filters
Lidar/Terrain Display Controls uses histograms to visualize the spread of loaded data values and how they are displayed in the workspace. Use the sliders, or text boxes, to dictate the upper and lower bounds of the data to be displayed.
- Draw Mode contains settings for both point clouds and raster elevation display. The Draw Mode histogram slider determines how shader colors are scaled to loaded values.
- Point Filters contains lidar/point cloud filter settings. The Point Filter histogram sliders adjust which points are visible in the workspace based on specified attributes and ranges. Once filtered out, points are excluded from processes such as gridding or contour creation, but are not deleted. Point Filters require Global Mapper Pro.
Draw Mode
|
|
*Some Draw Mode features require Global Mapper Pro and are indicated with an asterisk * |
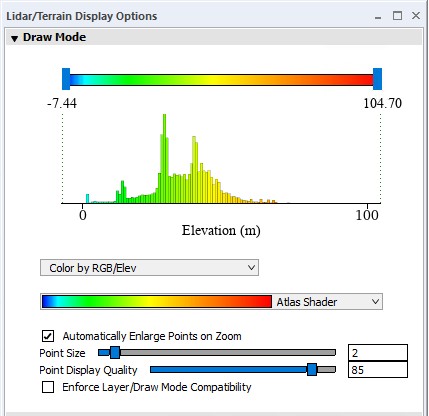
Use the Draw Mode histogram sliders to dynamically scale shaders to fit a specified minimum and maximum. Values outside of the specified range will be assigned a uniform color based on the shader, highlighting the values in between. This does not alter the actual elevation values, only how they are displayed.
Changes made through the Draw Mode histogram and shader selector will be applied to both point clouds and raster elevation layers enabled in the Control Center.
The elevation legend will display the shader for the last layer drawn in Control Center.
* Lidar Draw Mode (Color By...):
Point cloud data can be colored using various point attributes. This changes the display of the points based on existing or calculated attributes. The full list of options can be found on the Lidar Draw Mode page. This dropdown setting is mirrored in the Lidar Toolbar. This setting can also be adjusted on a per-layer basis in the layer's Lidar Vector Options.
Changing the point cloud draw mode (Color by...) to an attribute other than elevation will automatically turn off any loaded terrain layers in the control center in order to avoid conflicting scale bars if Enforce Layer/Draw Mode Compatibility is enabled.
Color by Scan Angle - Color Using Absolute Value
When the draw mode is set to Color by Scan Angle, the setting “Color by Scan Angle - Color Using Absolute Value becomes available. This setting allows the scan angles to be colored based on absolute value. This matches the setting found in Lidar Configuration.
Shader:
Shaders are the color ramp or color steps that are applied to the range of data, elevation, intensity, etc. Choose a shader from the dropdown to apply to both point cloud and terrain data. The full list of shaders can be found on the Shader Options page. Any existing Custom Shaders will also be listed here.
This dropdown setting is mirrored in the Viewer Toolbar.
Automatically Enlarge Points on Zoom:
Check this option to enable dynamic point sizing based on zoom level. Points will automatically enlarge when zooming in, and shrink when zooming out for best visibility. This is an alternative to the Point Size setting.
*Point Size:
This setting specifies how large the points are drawn in the workspace.
Specifying a point size here in the Display Controls will disable the autoscaling feature (Automatically Enlarge Points on Zoom), meaning the points will maintain their size regardless of zoom level.
*Point Display Quality:
To speed up rendering of data, the point cloud display can be thinned or decluttered visually in the 2D map view. This controls how much the point cloud is thinned when zoomed out to speed up display. Increase the quality to draw more points, decrease the quality to draw fewer points but more quickly. The default setting is 85.
Note: this does not affect the 3D view, which renders more points closer to the camera.
Enforce Layer/Draw Mode Compatibility:
Check this option to have terrain layers disabled when a non-elevation lidar draw mode (Color By…) is chosen.
Only one scale bar can be displayed at a time. When lidar and terrain data are simultaneously displayed, there is a potential for multiple data types to be displayed without a corresponding legend. To prevent data from being displayed in the workspace without a corresponding legend, when this setting is enabled, a lidar Draw by option is chosen that conflicts with a loaded raster shader, the terrain layer will be turned off (unchecked in the control center). For example, an elevation raster would be turned off when the Color By Intensity is chosen. Leave this box unchecked to keep the legacy functionality, which keeps layers active even if they may not match the displayed legend. Reguardless, The elevation legend displays the shader for the last layer drawn in Control Center.
Point Filters
|
|
This tool requires Global Mapper Pro |
Point Filters control the global visibility of lidar/point cloud data based on a specified attribute. Points that have been hidden by the filter will not be included in exports or used in analysis tools, with a few exceptions such as applying an elevation fit to a layer in the Lidar QC tool: Compare/Adjust Point Cloud to Control Points.
These options are mirrored in the Lidar Configurationsection of the  Configuration menu.
Quick Steps for Point Cloud Filtering:
Point Filters will auto-populate with the attributes and corresponding values found in the loaded point cloud data.
Check the box to apply the chosen attribute filter.
The filter will automatically be applied.
To dictate the upper and lower bounds of the data to be included, either type min/max values in the box, or use the histogram slider.
Use the Reset button to restore the Min and Max values for that attribute.
Attributes that can be used for filtering are based on what is included in the loaded datasets. They are often the same as those available in the Lidar Draw Mode, including but not limited to:
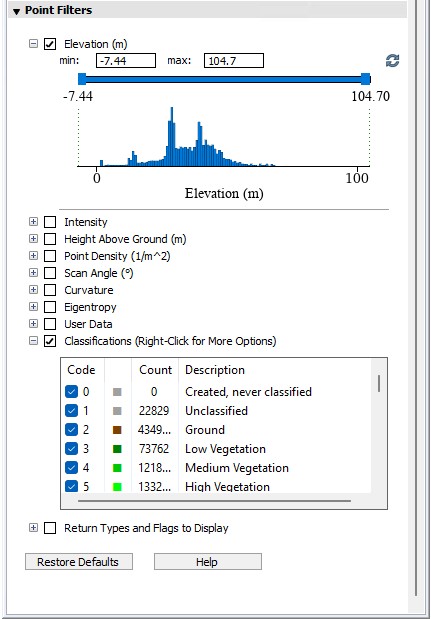
Elevation:
Filters points to a range of elevations.
Classifications:
Enable and disable the visibility of points based on classification code.
Right-click any description for check all / uncheck all options, or to customize the classification codes. See Lidar Class Properties for more information.
Intensity:
Filter lidar points based on the intensity of the return pulse.
Most topographic lidar systems record the intensity of the return pulse, loosely representing the reflectance of the feature being measured. Intensity values typically range from 0 (weakest reflectance) to 255 (strongest reflectance). Other factors that can influence intensity values include scan angle (features that are nadir/closer to the sensor will have stronger reflectance values), texture, and moisture content. These values are relative to the dataset, so there may be variance in values between datasets even from the same location/sensor. The number of lidar returns overall is also affected by the composition of the surface object reflecting the return.
Point Density (pts / m2):
Filter data based on the calculated point density as measured in number of points per square meter. This is calculated on load based on other points in the layer.
Scan angle (degrees):
The angle of the scan relative to the scanner. Values range from -90 to 90, with 0 being directly below or in front of the scanner.
NDVI:
If the points have Red and IR (Infrared) values associated with them, they may be filtered by NDVI value. Normalized Difference Vegetation Index values range from -1 to 1. For more information see NDVI.
NDWI:
If the points have NDWI values associated with them, they may be used for filtering. This uses the Green and NIR channels to identify water in water bodies. For more information see NDWI.
NIR:
Filter lidar data that contains near-infrared attributes. This filter option appears after NIR has been chosen as a Draw Mode.
Return Types and Flag to Display
Return Type:
Return types are a descriptive combination of the RETURN_CNT and RETURN_NUM attributes. Uncheck any of the Return Type values (Unknown, First, Second. etc.) to keep points with those values from displaying in the active workspace.
Flag:
Flags are used in some datasets to identify certain lidar types (Synthetic, Key-point, Overlap, Withheld, Edge of Flight line, None). Uncheck any of these options to keep points of this type from displaying in the active workspace.
Update Return Number/ Count when Deleting Points:
This setting will modify the return count (RETURN_CNT) and return number (RETURN_NUM) attributes of points when a point from the same pulse has been marked as deleted.
When a point is undeleted, the original return number and return counts will be restored for the related points.
Pulses Identified by GPS Time and ___:
Select Only GPS Time, User Data, Point Source ID or Scanner Channel as the property to determine the point return type along with GPS time.
Restore Defaults
This will reset all Draw Mode and Point Filter settings.