Area, Line, and Point Styles Tabs
The Area Styles, Line Styles, and Point Styles tabs provide the ability to customize how area, line, and point features found in the selected layer(s) are displayed.
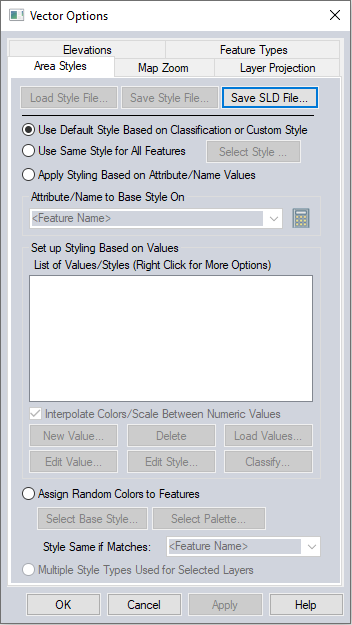
The following style settings are available:
Load Style File
Load a *.gm_layer_style file or Style Layer Descriptor (SLD) file to style the layer. This option is available when applying a single style to all features, styling by attribute, or assigning random colors to features.
When importing vector data if an SLD file of the same name is present in the data directory, the described styles will be automatically used.
Save Style File
Save the current style to a *.gm_layer_style file . This option is available when styling by attribute or assigning random colors to features.
Save SLD File
Select this option to save the style to an SLD style file. This is an OGC specified style format, Styled Layer Descriptor, used in some WMS implementations.
This option requires one of the following style options being set:
- Use Same Style for All Features
- Use Default Style Based on Classification / Custom Style - If all features in the layer(s) use the same style (including font) then this will behave the same as the 'Use Same Style for All Features' option. If there are any differences you will get an error as SLD doesn't have a straight-forward method for saving separate styles for each feature.
- Apply Styling Based on Attribute Name/Values - the created SLD in this case will use the SLD conditional tags to specify which attribute values given styles apply for
Use Default Style Based on Classification or Custom Style
This option is the default and specifies that features should be drawn and labeled using either the custom style applied to each feature, or the default drawing style for the classification assigned to each feature. The default drawing style for any particular classification can be configured on the Area Styles tab of the Configuration dialog, the Line Styles tab of the Configuration dialog, or the Point Styles tab of the Configuration dialog.
Use Same Style for All Features
This option specifies that all features in the selected layer(s) should be drawn with the same drawing style, regardless of type or any custom style applied.
The Select Style... button will display a series of dialogs to specify the style, based on the geometry type:
Apply Styling Based on Attribute/ Name Values
This option provides a way to base the drawing style on the value of a particular attribute. This is a powerful feature allowing the user to assign a style to a particular value for a particular attribute. Any features whose value for the selected attribute/ name matches the selected value will be assigned that style.
To build a style based on an existing attribute, select the attribute from the drop down list (Attribute/Name to Base Style on). To calculate a new attribute to use for style, click on the button to open the Attribute Calculator.
If the Interpolate Colors/Scale Between Numeric Values option is checked, any numeric values for the selected attribute/ name that do not exactly match a value will find the two closest numeric values and interpolate the color values in between those numbers.
For more information about style options see Point Symbol, Line Symbology and Area Symbology.
Load Values...
Use the Load Values button to automatically create different styles based on the attribute values. The select style dialog will appear to allow choosing a base style, then a prompt to assign random colors to the values will appear. If yes is selected to assign random colors the values, a dialog will appear prompting the selection of a palette from which the colors will be randomly assigned.
When all values are numeric, there will be a dialog option to use just the min/ max value. This will produce separate styles for the minimum and maximum values of the attribute in the layer, as well as styles for the average value. Based on the data this may also produce styles for 2 standard deviations below the average (if greater than minimum) and 2 standard deviations above the average (if less than maximum).
Right-click on an existing attribute/ style pair to get a menu of additional options, including one to clone that item into a new value using the same style.
Classify...
Use the Classify button to classify the features in the layer by an attribute value for styling. This will open the Classify Point/Line/Area Features dialog. the Feature Style options vary for point line and area features, but generally reflect the options for Point Symbols, Line Styles, and Area Styles.

To build a style based on an existing attribute, select an existing attribute from the Classification Value drop down list. The attribute selected must contain numeric values.
Classification Options
Select the Method and Number of Classes for the feature classification. Available methods are Equal Interval, Equal Count (Quantile), and Natural Breaks (Jenks). Click the Classify button to classify the value based on the selected method and number of classes. This will be reflected in the displayed histogram.
Area/Line/Point Style
Use the Color Ramp drop down list to select an existing color ramp or create a custom color ramp. When enabled, the Invert Colors check box will use the reverse order of colors in the selected color ramp. To create a custom color ramp, manually add colors to the palette in the Set Up Color Ramp dialog, Load a Palette File , or initialize a palette from an existing color ramp with the Init. from Built-in Palette button. If additional color classes are needed when the custom color ramp is created, Global Mapper will interpolate between the added colors.
Set the Point Symbol or Line/Area Style for the features. The colors will be applied according to the set Classification Options and Color Ramp. For more information about style options see Point Symbol, Line Symbology and Area Symbology.
Click OK from the Classify Point/Line/Area Features dialog to return to the Point/Line/Area Styles tab of the Vector Options dialog and see the configured classes and styles populate the List of Values/Styles.
New Value...
Use the New Value button to manually enter a new value and set a style. Use wildcard (* and ?) characters in your attribute value to match on values matching some pattern.
Any features that do not have a matching attribute/ name value will use the default style assignment for their type or the custom style if one has been set.
Edit Value...
Use the Edit Value button to individually edit a value for the selected value in the loaded values list.
Edit Style...
Use the Edit Style button to edit the styles for the selected values in the loaded values list.
Delete...
Delete the selected value(s) from the list of loaded values/styles.
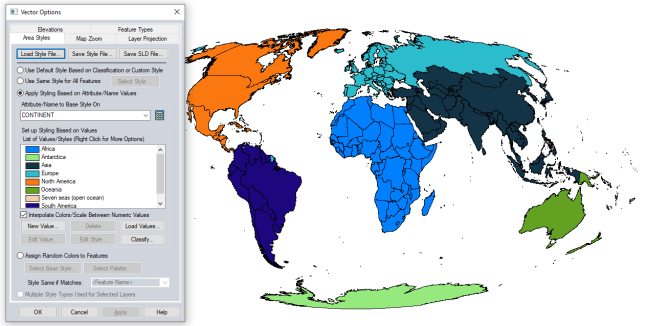
Example 1
The following area styles were generated from the default data (countries) using the CONTINENT attribute. the Load Values button was selected, and then a base style with a solid fill and palette of colors was chosen:
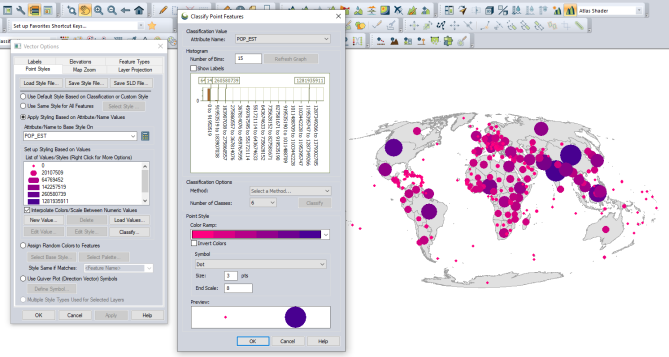
Example 2
The following point styles were created using the Classify options. Because the attribute POP_EST is numeric the Classify option is able to be used. The color and size of the symbols were determined by the attribute value, classification set up, and point symbol options.
Note these points were generated by taking the centroid of the default data. Points that contain no value for the attribute use the default point style for the feature type, since there is no style defined for an empty attribute value.
Assign Random Colors to Features
This option specifies that each feature shall be assigned a random color, either from the full set of 24-bit colors, or from a collection of colors specified by the user in a palette. The user can use the Select Base Style button to assign the base style whose color will be randomly assigned, and use the Select Palette button to assign random colors from a manually created palette, loaded from a file or initialized from a palette raster layer or built-in color ramp. For areas, if the selected style uses no area fill, then the area border color will be varied rather than the fill color. For point features, you need to have a dot or custom shape (like dot, diamond, square, etc.) selected as the symbol for the color randomization to work properly.
The Style Same if Matches drop-down menu allows the user to select an attribute to style by when assigning random colors to features. All features with a shared value for the selected attribute will be assigned the same color.
Use Quiver Plot (Direction Vector) Symbols
Point Styles also provide an option to use a quiver plot symbol, where the size and orientation of the symbol are derived from attributes.
For more information see Quiver Plot