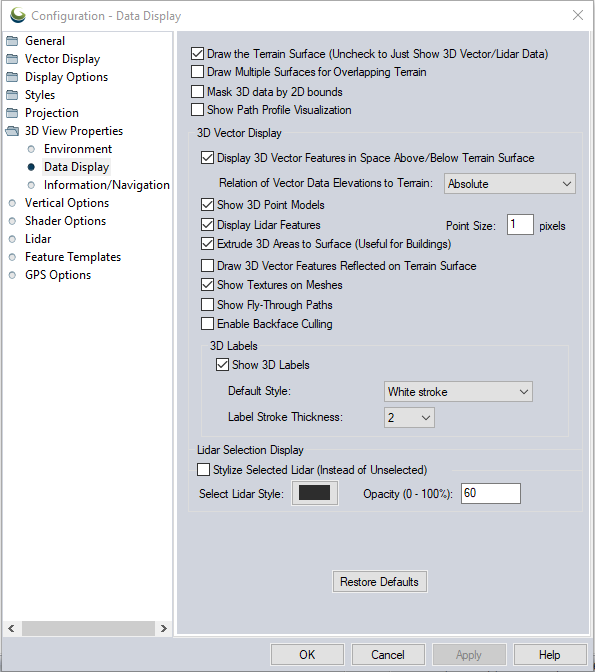
Data Display
The 3D View Data Display options determine what data types will show in the 3D Viewer and how they will be displayed. Options in this dialog include 3D vector, terrain, and lidar display.
Access the 3D View Data Display options by selecting the  Configuration button from the 3D Window. Or, select the Configuration button from the File Toolbar or Tools menu, and navigate to the 3D View Properties section. In the Configuration dialog navigate to Data Display section in the 3D View Properties folder.
| Draw the Terrain Surface |
Un-checking the Draw the Terrain Surface check-box will turn off the display of the terrain surface and draped data, leaving only any 3D vector data or LiDAR point cloud data. This can be useful for adding relative offsets to 3D vector features, when the surface display is not needed. |
|---|---|
| Draw Multiple Surfaces for Overlapping Terrain |
Check this option to display multiple layers of elevation datasets at locations where the elevation datasets overlap. This is good for rendering subsurface terrains. See 3D Multi Layer Surfaces for more information and examples. |
| Mask 3D Data by 2D bounds |
Enable this option to mask the 3D view to show only the extent of the primary 2D map view. This setting will hide the display of additional data outside of the 2D bounds, but does not stop the load of enabled data in the 3D View. For the best performance, use other methods to limit the loading of large datasets in 3D. |
| Show Path Profile Visualization |
When Path Profile with 3D Cutaway is enabled, the path profile cutaway will override the masking to the 2D bounds. |
3D Vector Display Options
| Display 3D Vector Features in Space Above/ Below Terrain Surface |
Use this option turn toggle on and off the display of 3D vector features. This setting does not impact Lidar data. |
|---|---|
| Relation of Vector Data Elevations to Terrain |
Specify what the height or elevation values of vector features are relative to. This will only apply to layers with an Altitude Mode of Unspecified. It is overridden by Layer specified Altitude Mode or Feature specified Altitude Mode settings.
|
| Show 3D Point Models |
Turn on or off the display of point features specified with a 3D model style. |
| Display Lidar Features |
Turn on or off the display of loaded lidar data in the 3D View. Use the Point Size field to set the default display size in pixels of the lidar points in the 3D Viewer. To vary the point size per layer using the Layer Option Always Draw Points at fixed size, set this value to 0. |
| Extrude 3D Areas to Surface (Useful for Buildings) |
Turn on this setting to draw sides on 3D area features extending to the ground. When extruding to the surface, the default base of the extrusion is set just below the minimum elevation, so your extruded areas should always extend through the terrain surface. |
| Draw 3D Vector Features Reflected on Terrain Surface |
Check this option to drape 3D vector features on the terrain surface. Draped vectors are not selectable. |
| Show Textures in Meshes |
3D Models may contained fill patterns or photo-realistic displays for the polygons that make up the mesh. Un-check this option to hide the rendering of these textures in 3D. Toggle 3D model / mesh textures on and off with the T key |
| Show Fly Through Paths |
3D line features that have been set up at Fly-Through-Paths will be displayed when this is checked. By default Fly Though Paths are hidden. |
| Enable Backface Culling |
Check this option to hide 3D mesh faces that are pointing away from the camera. Toggle backface culling on and off with the CTRL + B keys |
3D Labels
*To view Text labels in 3D View the labels must be in their own Label Layer.
| Show 3D Labels |
Toggle on to display text labels in the 3D Viewer. |
|---|---|
| Default Style |
Choose a color to outline the text characters with: White stroke or Black stroke. The text itself is black. |
| Label Stroke Thickness |
Specify the text outline color (stroke) thickness from 0 - 4 pixels. |
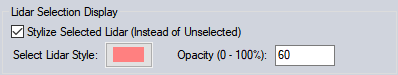
Lidar Selection Display
Specify how selected lidar points appear in the 3D view. A color overlay with an transparency setting can be applied to either selected lidar points or deselected lidar points to highlight the selection while still maintaining other color reference and context.
The default will apply a gray overlay to deselected points, so that they are desaturated compared to the selected lidar points. This setting may not be optimal for all lidar color modes, such as Color by Intensity using the standard grayscale shader, so it can be customized to better highlight selected points or de-emphasize non-selected lidar points.
Stylize Selected Lidar (Instead of Inselected) – Check this option to apply the color overlay specified below to selected points in the 3D view. The default is to apply a color overlay to the deselected points.
Example:
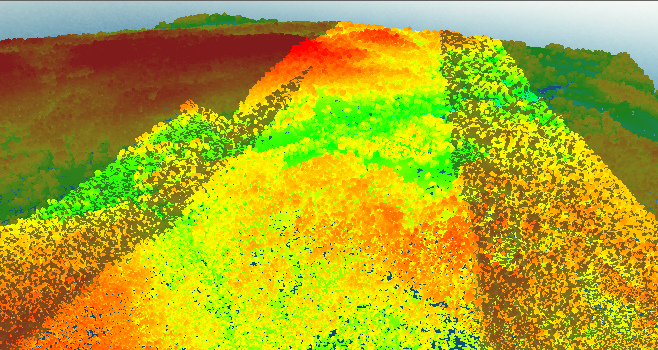
The default selection style applies a gray overlay to de-selected points so they appear desaturated in the 3D view, highlighting the selected points.
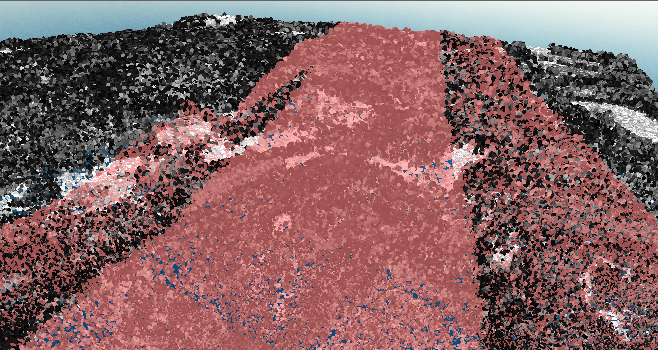
Here a light red overlay is instead applied to selected points when the points have been colorized by intensity. This makes the selection more obvious when the points are colored this way.
Restore Defaults
Press this button to reset the values for all 3D display options.