Custom Point Cloud Classification (Beta)
The Custom Feature Models tool can be found within the Automatic Point Cloud Analysis tool. Check the box to Enable Custom Classification.
|
|
This tool requires Global Mapper Pro |
Custom Feature Classification (Beta) provides the ability to define custom classifications based on user-created training samples. Each training sample should represent a variation of a definable class of objects that can be used to create a new, user-trained point cloud classification. The attributes and shape of the sample points will be used to generate a signature that will be the basis of the new custom classification model.
Once finished, new classifications will appear in the Features to Classify list in the Classification tab to be used along with the built in Feature Classes, such as Vegetation and Buildings.
Quick Steps to Create a Custom Classification:
This works best if the desired features in the point cloud have already been segmented, ensuring that all selected points have similar characteristics, but it is not required. Points may be sampled from multiple point clouds.
-
Check the box to Enable Custom Classification (Beta). This will open the Training Samples window, and add new options below the check box.
-
Click Add Class to generate and name your new custom point cloud class.
-
In the workspace, select the points or segments that represent the features to be used to train the new classification. A class can be trained multiple times.
-
Tip: Hold CTRL on the keyboard to select multiple segments at once.
-
-
In the Training Samples window click Collect Sample.
-
Choose a class from the drop down menu.
-
Click Train under the classification in the Feature Models section. Global Mapper will analyze these samples and display the characteristics and attributes that make up the sample's Signature.
-
The Feature Model Plot can be used to visualize and compare all segmentation classifications, including the built-ins models. This is useful for making sure the classifications are distinct.
-
-
The new custom feature classification will now be available for use in the Classification section when the Enable Custom Feature Models option is checked.
Training Samples Window
Use this window to collect the signatures of selected points from the workspace and assign them to a class. Collected samples are not applied until the Train button is clicked for the classification in the left window.
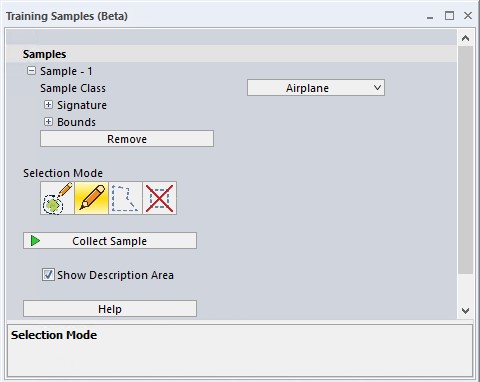
Samples
These are created automatically as samples are Collected.
-
Sample Class - choose which class the sample will be applied to. To add points to a new class, first be sure the class has been created or already exists in the Automatic Point Cloud Analysis window. Click Add Class to create a new class.
-
Remove - removes samples from this list. Note, this does not change samples that have already been used to train a classification.
Selection Mode
Choose a tool for selecting points in the workspace.
-
 The Select by Segments tool selects clusters of points in segmented point clouds.
 -
 Use the Digitizer tool to manually select points.
 -
Select by segments is recommended to create cleaner and more accurate training samples.
-
-
 The Clear Selection button unselects all the points currently selected in the workspace. The ESC key on your keyboard will perform the same function when the digitizer is active.
Collect Sample
This option creates a training sample based on the selected points in the workspace. Once collected, samples can be assigned to a Sample Class in the Training Samples window.
Options in the Classification and Extraction Settings window
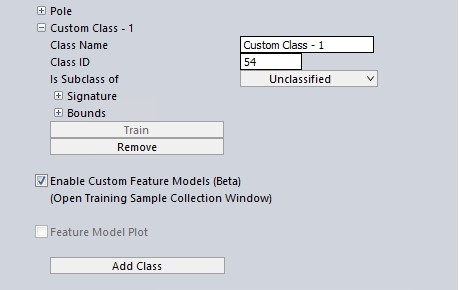
Add Class
Use this button to begin the process of creating a new custom classification. A new editable class option will appear under Feature Models:
Class Name: Name the new classification.
Class ID: is assigned chronologically starting at #54, after the ASPRS definition.
Is Subclass of: If this classification is to be a subclass of another existing classification, choose the parent classification here. During point cloud processing, Global Mapper will treat the subclassification as part of the parent class, but the subclassification label will allow it to still be an individual class with its own color, etc.
Signature: will automatically populate as the classification is trained. An untrained classification will have all zeros. These values can also be manually edited to better tailor the analysis. Use the Feature Model Plot to compare these values to those of other classes.
Only 20 custom classes can be saved in the software at a time.
Classification styles, such as color and point size, can be edited in the Configuration menu in the Lidar section.
Train
Use this button to apply the collected training samples to a class. This button will activate when samples in the Training Samples window have been applied to the class.
This can be applied to any classification, and includes the ability to retrain existing built-in Max Likelihood classification methods.
To train built in Max Likelihoods:
-
First, enable custom feature models, then click Retrain under the classification in the Feature Models section.
-
When Enable Custom Feature Models is unchecked, the built-in Max Likelihood classifications will not follow the user-trained settings.
Load
Use this button to load a previously saved set of feature model parameters for a specific custom class. The APSRS classification codes must match between the model in the workspace and the one saved to the file. If a custom model is already present with that ASPRS classification code, it will be overwritten with the model from the file.
Save
Use this button to save the current feature model parameters to a JSON file for future use.
Remove
Use this button to delete a custom classification.
Load Models
Selecting this option allows for import of multiple custom feature models into the current workspace. Models within the saved JSON file that match an ASPRS code of an existing class will populate those feature models. Models within the file which do not have a matching ASPRS code will be added as additional classes.
Save Models
Selecting this option will save the entire set of currently loaded feature models into a file that can be imported later.
Signature
Every feature in a point cloud has a signature comprised of its characteristics, both within the points attributes and the spatial structure of how they are arranged together. A classification's signature is populated based on sampled points. The goal of a making or editing point cloud classifications is to create a signature that can be used to reliably describe a specific feature type in a point cloud. A signature is measured by these attributes:
Principal Components (i,j,k) - These three attributes measure the 3D shape of the points at the neighborhood level (neighborhood being set by the Resolution). This different from the Bounds setting as bounds looks at the feature or segment of points as a whole.
Principal Components are the principal axes of the covariance ellipse. A covariance ellipse is a 3D Gaussian distribution defined by the points in the local neighborhood. If you look at any one axis, the magnitude (principal component) is analogous to sigma^2 for the 1D case. This means that for a cluster of points on a plane, one of the components will be very small. For points on a line, two of the components will be very small. If points are evenly distributed (visualize a fuzzball), then all components are equal.
Eigentropy - measures the entropy of the principal components of the point cloud. Higher values mean more chaos. For example, entropy in a flat surface is very low, but it is high in vegetation.
Curvature (x,y,z) - analyzes the curves created by the points in a local neighborhood. Consistency in curvature values will help indicate that points likely belong to the same object.
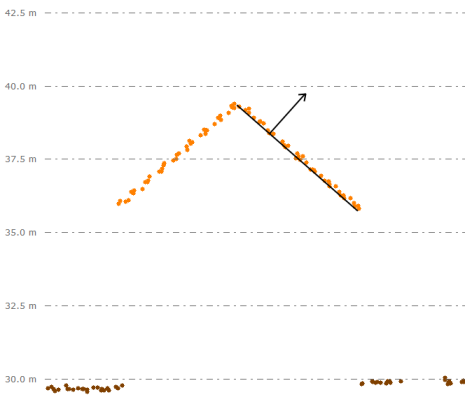
Normal (x,y,z) - measures the direction perpendicular to the surface the point is representing. Similar normal values over a local area indicate the points are representing a consistently shaped feature.
The normal of a lidar point can be depicted as a ray or arrow perpendicular to the surface the point represents. Looking at the cross section view of a roof, the plane of the roof is the surface represented by the points, and the normal for a single point is shown perpendicular to this plane moving away from the point.
Return Number - looks for similarity in the return number of each point return in the data set. Return numbers typically range from 1 to 5. Solid, uncovered surfaces typically have larger numbers of first and 'only returns' while vegetation and layered objects have a larger mix of return numbers. Use the Lidar Draw Mode setting to visualize returns in the point cloud.
Bounds
The bounds describe the overall shape of individual features. For example, a lamp post will have a different set of values from a car.
Feature Model Plot
The feature plot is a method of visualizing and comparing the signatures of existing classifications, and distinguishing which attributes are distinguishing characteristics between classifications.. This is especially useful for troubleshooting custom classes. Adjust the signatures to prevent overlap with another class. If class signatures are too close to one another, their classifications aren't going to be as reliable. In the example below, we can see that the built-in ground and vegetation classifications search for very different properties in a point cloud. The difference is especially highlighted in the curvature value, as the ground option is calibrated to only look for flat surfaces. When classifying a point cloud, if you notice that areas of steep terrain are being omitted from classification, you can increase the curvature value in the Feature Model Signature to include those areas.
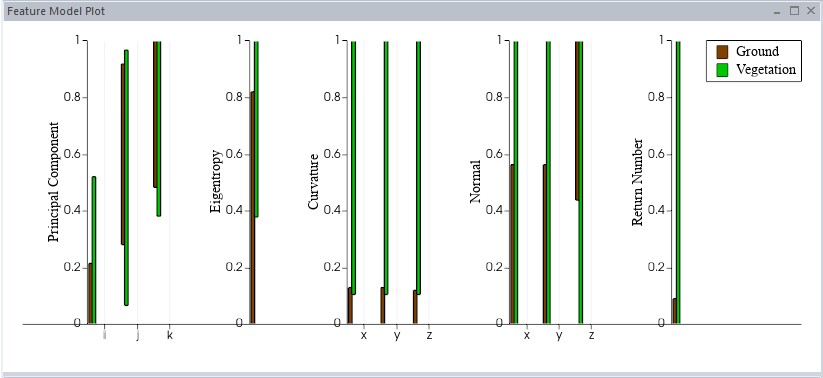
Use the checkboxes to turn on classes in the Classification tool to load them in the Feature Model Plot.