Image Overlap Statistics Report
The Image Overlap Report is automatically generated with the ground coverage polygons. It will open in your default browser, and is saved in a temporary folder on your machine. To save it for future use, or to send it to another user, save it through the browser options (ex. Print to PDF). This report can be generated for a single selected image, or on multiple at once.
The recommended overlap percentage is 60% front and 40% side. More is fine, but less can lead to holes in your final photometrically generated outputs.
For these statistics, a Bounding Box is generated to measure area estimates. In this case, a bounding box is the smallest rectangle that covers and contains all image footprints. Each image has a ground coverage polygon (red, in the example below), and all generated polygons are contained within the Bounding Box (Yellow). This is used in calculations such as Coverage Ratio.
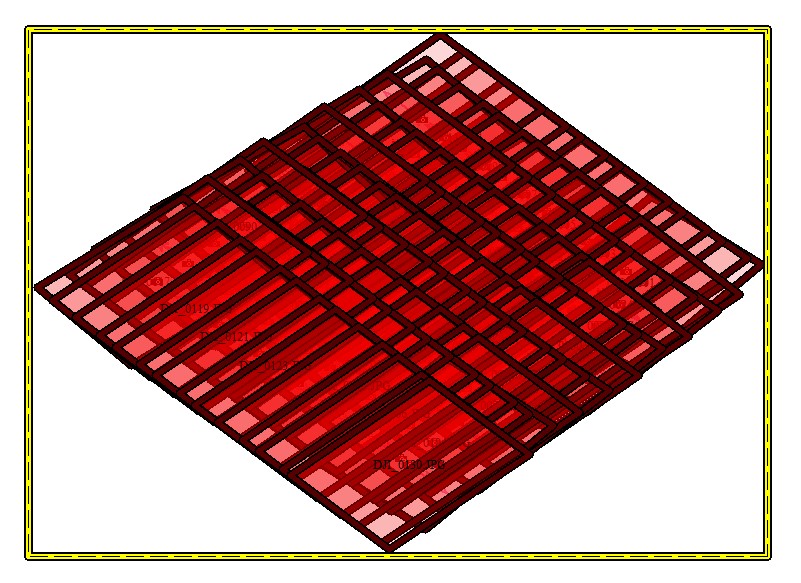
Note: The ground coverage polygons will be different when generated before Pixels to Points has been run compared to those generated after the reconstruction has finished. This is because the Pixels to Points reconstruction process will refine the camera parameters and position.
The Overlap Report consists of four sections: Overlap Statistics Misc, Image Relative Areas, Hit Overlap Histogram, and Side Neighbor Images.
Overlap Statistics Misc. table
The Overlap Statistics Misc. table displays the overlap percentages and a few estimates of accuracy for the footprint measurements.
-
Coverage Ratio - This is how well the generated Bounding Box matches the area that the image covers. It's the amount of the area (bounding box) covered by at least one image. It is covered area divided by total area.
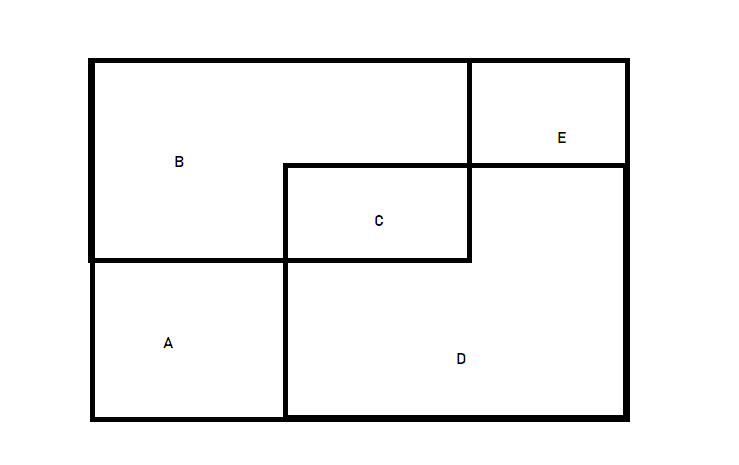 In this example, B and D are overlapping images within a bounding box. C is the overlapping area. The coverage ratio would be calculated with (B+C+D) / (A+B+C+D+E).
 -
Overlap Ratio – The amount of area (bounding box) that is covered by at least 2 images, divided by total area.
-
Average Area Calculation Error- To save processing time, the area of overlap is calculated approximately. Average Area Calculation Error is the estimated error of those approximations. An 1% error means the result was 101 instead 100.
-
Forward Overlap - The number of images that have overlap in the forward flight direction. The forward direction is defined by timestamps of the images.
-
Forward Disconnect - A count of non-overlapping images in the forward flight direction. The forward direction is defined by timestamps of the images.
-
Side Overlap - The number of images that have side overlap. The "side" direction is about 90 degrees bearing to the flight direction.
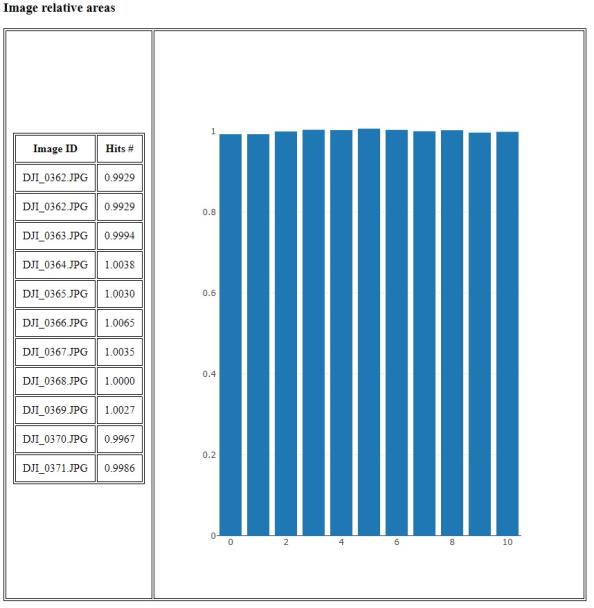
Image Relative Areas
The Image Relative Areas chart describes how the areas of each image differ from the average. It is a quality check for bounding polygon size estimation and construction. If all values are close to 1, then all images are approximately of the same area (size). If they vary widely, try generating the footprints again after the Pixels to Points reconstruction process.
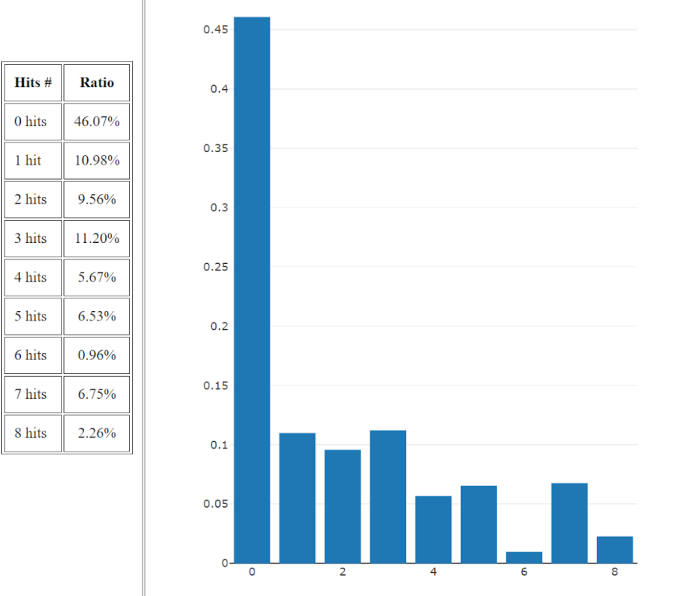
Hit Overlap Histogram
The Hit Overlap Histogram shows the number (percentage) of overlaying images in the bounding box (see description at top of page).
In the example image below:
-
0 Hits = 46% of the area in the bounding rectangle is not represented in the images at all.
-
1 hit = At least ~10.98 % of the bounding area has at least 1 image overlapping.
-
There are 8 images overlapping in 2.26% of the area.
Side Neighbor Images
Side Neighbor Images list is a table of all images, and the list of all other images it is overlapped by. This lets you see which images have no overlap, therefore won't construct well in Pixels to Points.