Variography and Kriging
|
|
This tool requires Global Mapper Pro |
The Variography and Kriging tool, accessed from the Vector Analysis Menu, creates variograms to perform geostatistical analysis in order to estimate continuous values from a dataset. This tool works with point cloud data and vector point data, considering one targeted attribute in the variogram plot, statistical analysis, and kriging method. The variography is useful as a data exploration tool outside its usage as an input to kriging estimation. For more information about the statistical formulas used with this tool download the pdf: Geostatistics with Global Mapper.
Kriging is best suited to data that is relatively consistent and uniform in all directions, therefore meeting requirements for stationarity and isotropy.
Stationarity is assumed as estimates are constructed as averages over all points, so statistics such as the mean and variance must not vary incredibly throughout the dataset. For example, differing ground cover types captured within a point cloud may increase error since dense forest, bare earth, urban areas, and open water, all have different statistical properties. For use with point cloud data, filtering can be used to improve stationarity for the input points.
Isotropy assumes data is uniform in all directions. The directionality of the data can be further explored in the Variogram Map through the display of the Range Ellipse and Anisotropy Ratio value.
General Steps for Kriging
-
Open the Vector Analysis Menu and select Variography and Kriging...
-
In the Input section of theVariography and Kriging window check the box next to the input layer and set the Value Attribute to plot the Empirical Variogram. Explore the input data by displaying the Input Histogram.
-
Under Variography in theVariography and Kriging window adjust parameter values to alter the plot. Adjust the Distance Cutoff so that the variogram plot levels off, and modify the Num Bins to have few enough that each one has a smaller error bar (indicating each point has good statistics). Achieving a good empirical variogram plot allows a theoretical model to be better fit, resulting in better kriged estimates.
Use the Variogram Map to explore the directionality of the input data.
-
Expand the Theoretical Variogram Data Models drop-down and select to Show Plot for the different theoretical variogram plots to populate the model values and visually determine which is the best fit for the data. Often a lower Reduced Chi Sq Score indicates a better model fit.
-
To create kriged estimates open the Kriging drop-down section and set the Grid Spacing for the output layer. Under Data Model select the best fitting Data Model Type and click Create Kriged Estimates to generate the kriged output layer(s). Generated layers will appear in a layer group in the Control Center.
-
Expand Cross Validation and select to Show Plot for Cross Validation Reports.
The Kriged Estimates point cloud layer will display by default using the Lidar Draw Mode Color by Generic Value. The Generic Value is the estimated value derived from the kriging process.
Consisting of floating-pane windows, the Variography and Kriging tool initially shows the Empirical Variogram window and allows you to modify the data bounds, and kriging settings and method in theVariography and Kriging window. Additional floating-pane windows will open as additional charts are opened through the Variography and Kriging options. These windows can be resized, moved, and docked within the main Global Mapper view.
Variogram
The variogram plots the variance as a function of separation distance . The x axis, h, is the distance between samples, and the y axis, Variance(h) (the typical notation for this is 2 \gamma(h)), is a measure of variability in the points separated by that distance. The Variogram window is displayed by default and populated once input data is set, but the parameters and display options can be modified in the Variography and Kriging dialog.

Variography and Kriging
This dialog, comprised of many drop-down sections, customizes the input data, plotted variogram, theoretical variogram data model, and kriging execution.
When enabled Show Plot check-boxes found under many items will open a new floating-pane window displaying a chart, or plot the value or function in the Variogram window. Calculated values for an item will populated or updated when the Show Plot option is enabled. Plots can be customized with the available style fields such as Title, Color, Line Width, Line Style, Marker Style, Marker Size, Label, X Label, and Y Label.

Input
Specify the input data and explore the input data histogram and key statistics.
Layer Data - Check the boxes for the layers to be considered in the variogram and kriging analysis. Use the Selected Only checkbox option to only consider the selected points.
Specify Bounds - Use Specify Bounds to set the input data bounds with the standard Data Bounds options.
Filter Points - When using a point cloud, filter the input points via the Advanced Lidar Filtering dialog.
Value Attribute - Select which attribute to consider from the drop-down. The value attribute selected will be used to plot the variogram and in the statistical analysis and kriging process. With point cloud data the options are Elevation or Intensity values. With vector data any numeric attribute can be selected.
Mean, Variance, Standard Deviation, Point Spacing - Display various statistical values for the input data.
Input Histogram - Enable Show Plot to open the histogram of the input data in a new floating-pane window. Use the Num Bins to set the number of bins used to display the Input Histogram.
Variography
Variogram
The Variogram will initially be plotted with a theoretical best fit model. Changing the parameters will automatically adjust the displayed model. Once the Variogram has been displayed, the Theoretical Variogram Data Models and Kriging sections of the dialog will become visible.
Use options in this section to alter the settings for the Empirical Variogram. Changes will be automatically applied and will refresh the Variogram window. Changes made to the variogram plot will impact the Theoretical Variogram Data Models and Kriging outputs.
Num Bins - Set the number of bins used in empirical variogram. This will be the number of points plotted in the Empirical Variogram window. For each variogram bin estimates are constructed as an average and standard deviation over all point pairs that fall in that bin. The number of bins must be large enough to allow for a smooth fit over the range and small enough to allow sufficient statistics to be accumulated for each bin.
Distance Cutoff - Use the Value and Units fields to specify the maximum distance at which the variogram is evaluated.
Lag Size(m) - Lag is the distance between pairs at which the variogram is calculated.
Max Num Samples - Set the maximum number of samples to be included in the variogram analysis. Increasing the number of samples will reduce the uncertainty for each plotted point.
Empirical Sill - Displays the limit of variance at large distances. This represents the value of the variance at separation distances large enough for the values to be uncorrelated.
Empirical Range (m) - Displays the distance interval in meters before the sill estimated from the empirical variogram. This is the distance at which data is decorrelated or spatial correlation between data points effectively diminishes to zero.
Variogram Plot Options - Set display options for the Variogram.
Show Legend - Enable to show the variogram legend in the Empirical Variogram window. The legend will show all plots displayed in the empirical variogram window using the set Label for each plot. Click and drag the displayed legend to move it around the plot.
Scale Plot to Variance - Enable to plot variogram in dimensionless unit such that the plot is scaled to unit variance.
Capture Plot Window to File - saves the Variography and Kriging plot windows as PDF, SVG, or EPS files.
Empirical Sill - Enable Show Plot to display the empirical sill as a line on the variogram. It is the estimation of the sill parameter obtained from Empirical Variogram, representing the maximum spatial variability of the data.
Theoretical Variogram Data Models
A theoretical variogram is a continuous function representing the variance as a function of separation distance constructed by least squares fit to one of the available mathematical models. Available data models are:
Linear
Spherical
Exponential
Gaussian
Power
Selected Angle
Semi-Major
Semi-Minor
Use the Show Plot checkbox under any available model to show the theoretical model displayed in the Empirical Variogram window and populate the model values. The line style used to display each theoretical model in the Empirical Variogram model can be altered with the Label, Color, Line Width, and Line Style fields in each drop-down section.
In each theoretical variogram model section, the function for the model is shown. Expand this section to see the values in the function defined. These values, along with the following values, will populate only once the Show Plot option has been enabled for the model.
Reduced Chi Sq Score - All models will show a Reduced Chi Sq Score value once shown on the variogram. Generally, a lower Reduced Chi Sq Score indicates a better model fit meaning smaller differences between the theoretical variogram model and actual data.
Theoretical Sill - This sill value, the limit of variance at large distances, is displayed for the Sphere, Exponential, and Gaussian models. It is the expected or assumed maximum variance based on the theoretical variogram model chosen.
Theoretical Range - The distance interval in meters before the sill, is displayed for the Sphere, Exponential, and Gaussian models. It is the assumed or fitted range value from the chosen theoretical variogram model, representing the distance at which spatial correlation between data points is assumed to be negligible.
Fractal Dimension - This measure of roughness for the model is displayed for the Power, Selected Angle, Semi-Major, and Semi-Minor models.
Theoretical Nugget - Displayed for all models, the nugget value for the model is where the function intersects the X axis. This describes the variability at zero distance.
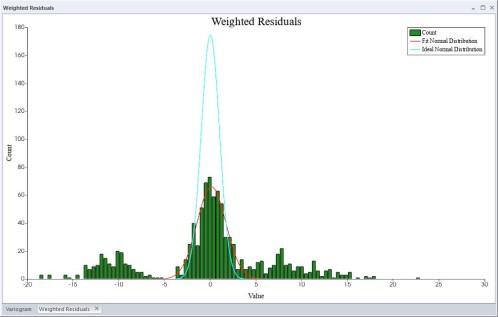
Model Residuals - All models provide the option to show the Model Residuals. Enabling Show Plot for the residuals of a model will display a histogram of the values in a new floating-pane window. The Title, axes labels, and Color of the histogram can be edited.
Model Sill - Available for all model except Linear and Power, Show Plot will display the sill value as a line on the variogram.
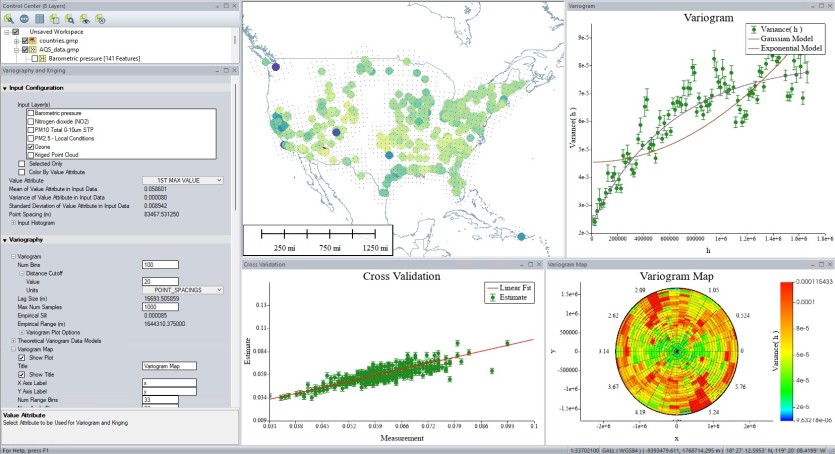
Variogram Map - Enable Show Plot to open the Variogram Map in a new window. A variogram map shows variance in relation to direction by shading plotted variance values by distance and direction. Changes made to the below settings will update the Variogram Map window:
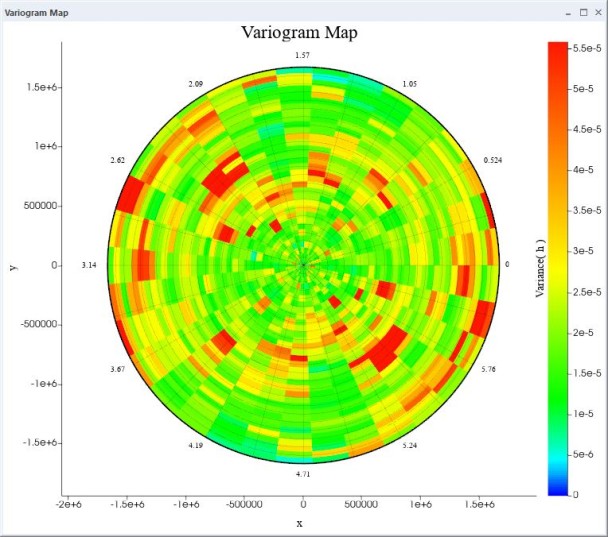
Num Range Bins - Set the number of range bins used to plot the variogram map. Distance bins are represented as circles centered on the origin. A lower number of bins will simplify the view.
Num Angle Bins - Set the number of angle bins to use in the variogram map. A lower number of angle bins will simplify the view.
Angle Units - Select radians ordegrees as the angle units.
Selected Angle - Plot the variance for a selected angle on the empirical variogram by enabling Show Plot and entering the Selected Angle Bin number. The selected angle will also be outlined on the variogram map. The Selected Angle Empirical Sill and Selected Angle Empirical Range for the selected angle will update if the Selected Angle Bin value is changed.
Range Ellipse - Enable Show Plot to display the range ellipse on the Variogram Map and populate the associated values. This ellipse shows the anisotropy, or directionality of the data. The Orientation is the angle between the x axis and the semi-major axis of the range ellipse in the selected Angle Units. The Anisotropy Ratio is the ratio of the lengths of the semi-major to semi-minor axes.
Semi-Major - The bearing in which samples are more related over larger distances. Once plotted on the Empirical Variogram with Show Plot, the Semi-major Angle Empirical Sill and Semi-major Empirical Range values will display.
Semi-Minor - The bearing opposite (180 degrees) from the Semi-Major. Once plotted on the Empirical Variogram with Show Plot, the Semi-minor Angle Empirical Sill and Semi-minor Empirical Range values will display.
Kriging
Set up the kriging output and click Create Kriged Estimates to generate the Kriged Point Cloud with options to generate gridded and mesh outputs. The Kriged Point Cloud layer generated from this process will contain uncertainty values which can be displayed by changing the Lidar Draw Mode to Color By Generic Uncertainty Value and/or gridded with the Generate Grid tool.
Grid Spacing - Set the grid spacing and units. The Approximate Number of Estimation Points will update based on the grid spacing. The generated kriged estimate layer will be created at this defined spacing.
Max Nearest Neighbor Distance - Set the distance within which a location must have a neighbor to generate a kriged estimate.
Kriged Gating Distance - Set the distance within which points will be included for a location's kriged estimate.
Nugget Effect - Disable the nugget effect to enforce the exact interpolator property. Using the nugget effect enforces the exact interpolator property by forcing the variation a zero distance to be zero. This ensures a kriged estimate will match the value of an input point if they occur at the same x,y location.
Allow Negative Weights - Allowing negative weights in the generation of kriged estimates can lead to wild values. It is recommended this option is disabled. For more info see.
Publish Results to Elevation Grid - Enabling this open will generated a gridded version of the krige estimates data as well as the default point cloud output
Publish Results to Mesh - Enabling this option will produce mesh layers from the kriged estimate point cloud colored by kriged estimate value and standard deviation.
Data Model - Select the Theoretical Variogram Model to be used in the creation of kriged estimates with the Data Model Type drop-down menu. Based on the model type selection the data model parameters will be automatically populated from the available theoretical Variogram.
Cross Validation - Cross-validation statistics play a crucial role in validating the accuracy and precision of Kriged estimates. This technique is essential in the Kriging model as it helps assess the model's accuracy and precision. The process involves estimating values at each measurement location based on all other data points except the one at that particular location. By comparing these estimated values with the actual measurements, the performance of the Kriging model can be thoroughly evaluated.
Cross Validation Statistics Report
Maximum Number of Sample Points - is the total number of times the Kriging model is evaluated during the cross-validation process. It is the number of predictions made by the model and the corresponding actual measurements used for evaluation.
Residual - is the difference between the predicted value and the actual observed value at a specific data point. It measures how close the estimate is to the measurement. The value is the average values across all data points.
Ideally, the residuals should be within the uncertainty most of the time, indicating that the Kriging model accurately predicts values that are very close to the actual measurements. Positive and negative residuals show the deviations of the model's predictions from the true values, and their presence suggests that the model may have some biases or inaccuracies. A positive residual suggests an overestimation of values, and a negative residual suggests an underestimation of values.
Residual Squared - It is the square of the Residual value. Like Residual, the Residual Squared value reported is the average values across the points.
Weighted Residual - It is the uncertainty in the measurements at different locations. The weighted residual is the residual divided by the square root of the Kriging variance. A lower weighted residual isn’t necessarily better, it could mean that the uncertainty is overestimated. The fundamental statistical test here is to check that the weighted residuals are normally distributed with zero mean and unit variance.
Weighted Residual Squared - It is the overall prediction error while considering the data point weights and is the square of the Weighted Residual Value.
Kriging Variance - It is an estimate of the uncertainty associated with the Kriging predictions at different locations. It is calculated based on the variance of the measurements at each location. A lower kriging variance indicates higher precision.