Create Viewshed
This tool performs a viewshed analysis using loaded elevation grid data with a user-specified transmitter location, height, and radius. A viewshed is an analysis that shows all of the locations that are visible from a given point, or likewise, all of the locations that can see the given point. All areas within the selected radius that have a clear line of sight to the transmitter are colored with a user-specified color.
This type of analysis can be used for communications engineering to measure the area that a signal transmitted from a tower will reach. In defense and emergency management, it is used to model all the areas that are visible from a lookout tower. Viewshed analysis also has numerous other applications, from real estate and planning to survey planning with a base station.
Access the Create Viewshed Tool from the Terrain Analysis Menu, from the Viewshed button from the Analysis toolbar, or with the Alt+V keyboard shortcut.
General Steps to Perform a Viewshed Analysis
-
Select the Create Viewshed tool from the Analysis toolbar or Tools Menu.
-
Left-click on the map at the position from which to measure the viewshed, i.e. the transmitter location.
A viewshed can also be calculated using a single or set of points a set of selected points. First, select the point(s) with the Digitizer tool. Then, use the option Calculate Viewsheds at Selected Points from the Digitizer menu under Analysis/ Measurement, or enable the Create Viewshed Tool and left-click anywhere on the map and when prompted choose to Create Viewshed at Each Selected Point.
-
Set the viewshed parameters in the Viewshed Setup dialog box described below.
-
Click OK to run the Viewshed Analysis.
Modify the parameters for a viewshed and run the analysis again by right-clicking on the Viewshed Analysis layer group in the Control Center and selecting to Edit Viewshed Parameters and Recalculate.
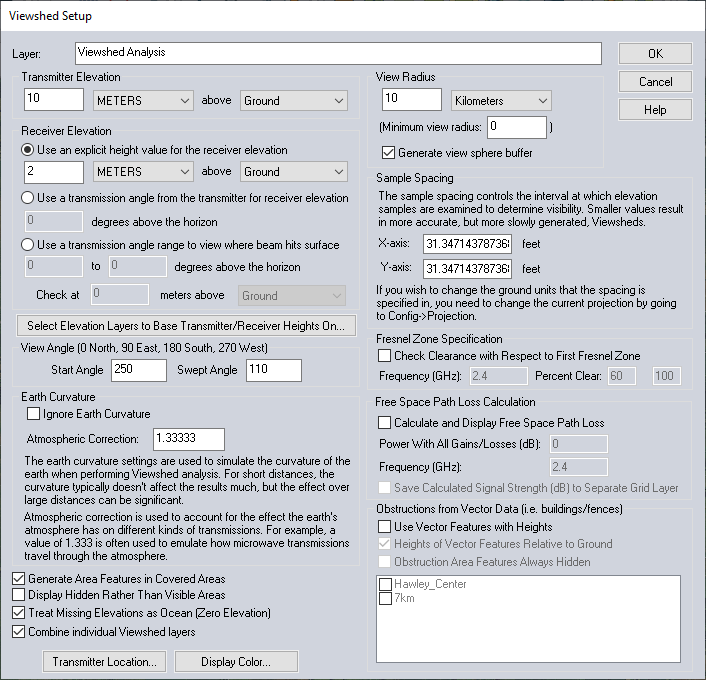
The Viewshed Setup dialog (pictured below) will appear, allowing you to set up the viewshed calculation.
Calculate Viewsheds at Multiple Points
With multiple point features, the
viewshed calculation values can be initialized from special attributes of the point features. The values selected on the dialog will be used, except
when a point features contains a viewshed parameter attribute. The attribute value will override
the dialog selection. Defining the viewshed parameters with attributes allows for calculating viewsheds in a batch, with different parameters for each selected point based the point attributes.
Setup
The Viewshed Setup dialog provides options allowing you to precisely set the parameters for the viewshed analysis.
Layer
Enter the layer name for this viewshed analysis. This name will be displayed in the Control Center and will also be the name of the transmitter point created by the analysis for display on the map.
Transmitter Elevation
The Transmitter Elevation section allows you to specify the height above ground or sea level for the transmitter that the viewshed analysis will be simulating.
Receiver Elevation
The Receiver Elevation section allows you to specify the minimum height above the ground or sea level from which the transmitter must be visible for the location to be considered visible. Most of the time you'll want to specify an elevation above ground, but specifying an elevation above sea level can be useful for aviation purposes.
You can also specify that the receiver elevation should be calculated based on an elevation angle relative to the horizon from the transmitter. This is useful if you have something like a radar dish that points up at some angle and you want to see where the signal can be seen.
You also have the option to specify a transmission angle range for a beam transmitted from the transmitter. Then the viewshed will depict where that beam would hit the terrain surface (or some user-specified distance above the surface).
The Select Elevation Layer(s) to Base Transmitter/ Receiver Heights On button displays a dialog allowing you to select which of the loaded elevation layers you want to base ground-relative transmitter and receiver heights on. The default is to use all loaded layers, but if you have a situation where you have a ground level data set loaded and perhaps another set with heights of buildings, etc., you could use this option to cause the transmitter and receiver heights to be based on the ground elevation, whereas the actual visibility of each point will use the topmost of any loaded layer.
View Radius
The View Radius section allows you to specify how far in each direction from the transmitter to check for visibility. Typically you'd want to set this to the effective range of your transmitter. If you want to ignore areas close to the transmitter, you can also specify a minimum view radius value. Use the default of 0 to include everything from the transmitter out to the selected view radius.
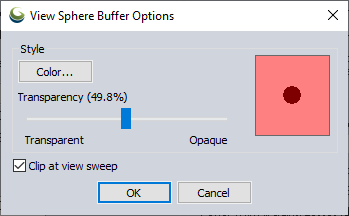
When enabled, the Generate Sphere Buffer option creates a spherical mesh buffer feature centered on the transmitter location and clipped at the reference terrain. This feature will be rendered in 3D to view the extent of the viewshed area in the 3D Viewer. Click on the '...' button next to the checkbox option to open the View Sphere Buffer Options. Here, the color and transparency of the mesh feature can be set, and an option to Clip at view sweep will crop the 3D buffer to the start and swept angle specified in the Viewshed Setup. The color and transparency of the generated view sphere mesh can be edited later through the Modify Feature Info dialog.
View Angle
The View Angle section allows you
to limit the viewshed to a particular subsection of the complete radial
area. The Start Angle specifies
the cartographic angle at which the radial subregion begins. This angle
is a cartographic angle, meaning that 0 degrees is north and angles increase
clockwise.
The Swept Angle specifies the number of degrees clockwise to include in the viewshed. For example, if the transmitter being analyzed sweeps an arc from due south to due west, a start angle of 180 with a swept angle of 90 would be used. To perform a viewshed analysis over the entire area, keep the defaults of starting at 0 degrees and sweeping through 360 degrees.
Earth Curvature
The Ignore Earth Curvature checkbox allows you to specify whether they want to take the curvature of the earth into account while performing the viewshed analysis. In addition, when earth curvature is being used, they can specify an Atmospheric Correction value to be used. The atmospheric correction value is useful when determining the viewshed for transmitting waves whose path is affected by the atmosphere. For example, when modeling microwave transmissions a value of 1.333 is typically used to emulate how microwaves are refracted by the atmosphere.
The Sample Spacing section allows you to specify the spacing of elevation samples when calculating the viewshed. The sample spacing controls the interval at which elevation samples are examined to determine visibility. Smaller values result in more accurate, but more slowly generated, viewsheds.
Fresnel Zone Specification
The Fresnel Zone Specification section allows you to have the viewshed analysis also check that a certain portion (the Percent Clear value) of the first Fresnel zone for a transmission of a particular frequency is clear. The typical standard is that good visibility requires that at least 60% (the default) of the first Fresnel zone for the specified frequency be clear of obstructions. If you specify a maximum Fresnel zone percentage clear other than 100%, only those locations where the minimum percentage of the 1st Fresnel zone that is clear is between your specified percentages will be marked as visible.
Free Space Path Loss
The Free Space Path Loss Calculation section allows you to display the power at any given location taking free space path loss into account. You can specify the total power from the rest of the link budget (i.e. transmission power plus antenna gain minus any other power losses excluding free space path loss) and the signal frequency. Then as you move the cursor over the viewshed you can see the remaining power at the location. In addition the viewshed will get more transparent as the signal power becomes less.
Obstructions from Vector Data
This section allows you to specify whether or not loaded vector data with elevation values should be considered when performing the viewshed analysis. This allows you to use things like buildings, fence lines, towers, etc. to block portions of the view, creating a more realistic viewshed.
If the option in Use Vector Feature with Heights is enabled, you can also specify whether the elevation values stored with vector features are relative to the ground by enabling Heights of Vector Features Relative to Ground, or leave this option disabled indicating heights are relative to mean sea level. Typically heights for vector features are specified relative to the ground. If any area features are included and their heights are relative to the ground, the obstruction heights within those areas will be increased by the specified amount, but any receiver heights will still be based on the terrain. This makes things like wooded areas very easy to model.
The Obstruction Area Features Always Hidden option allows you to specify that any locations within an obstruction area will be marked as hidden, rather than only those that actually would be hidden.
Additional Options
If checked, the Generate Area Features in Covered Areas option specifies that viewshed coverage area (polygon) features should be generated for those areas that are visible. These generated area features then behave just like any other vector feature and can be exported to vector formats, like Shapefiles, for use in other software.
If checked, the Display Hidden Rather than Visible Areas option causes the generated viewshed to cover those areas that would NOT be visible, rather than those that would be visible from the transmitter location.
When processing multiple viewsheds at one time, when selected the Combine individual Viewshed layers option will combine the individual Viewshed outputs into a single overlapping layer. Each viewshed feature retains it's individual feature attributes. An additional TOWER_ID attribute is added to allow for the ability to select attributes (viewsheds) by tower points.
Pressing the Select Transmitter Location... button displays a dialog that allows you to adjust the exact transmitter coordinates from the coordinates where they clicked.
Pressing the Display Color... button displays a dialog that allows you to select the color in which to display the visible areas on the map.
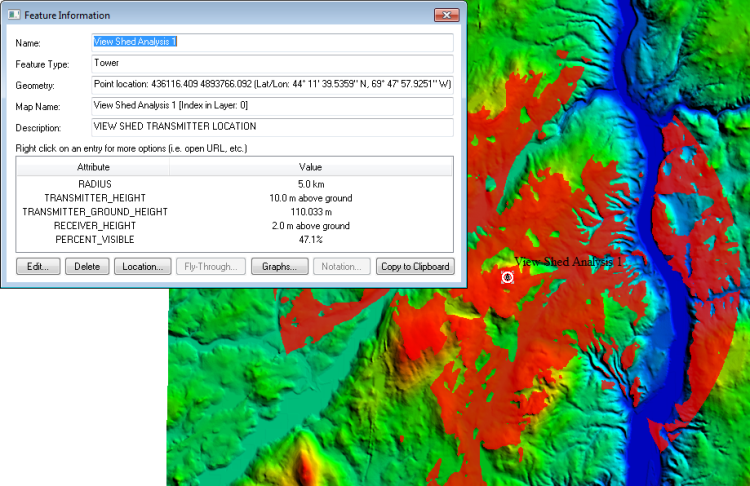
After setting up the viewshed calculation in the dialog and pressing the OK button, the viewshed analysis will be performed and when complete, the results will be displayed on the main map display as a new overlay. All visible areas within the specified radius will be displayed using the selected color. The overlay will default to being 50% translucent, allowing you to see areas underneath the viewshed. You can modify the translucency of the overlay in the Control Center.
In addition, a small radio tower point will be created at the selected transmitter location. When selected using the pick tool, this point displays information about the viewshed analysis as shown below.
If you would like to modify the settings used to calculate the viewshed and recalculate it using currently loaded data, you can right click on the Viewshed layer in the Control Center and select the option to modify the viewshed.
Example: