 Metadata
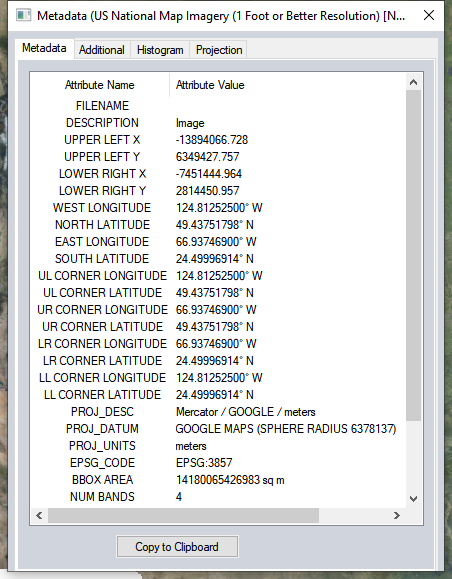
Double click a layer in the Control Center and press M key to open metadata for the layer. Or right click on a layer and chose Metadata... from the list. This displays metadata for the selected overlay. The metadata dialog displayed depends on the type of the selected overlay. The metadata dialog for the download-able US National Map 1 ft Imagery is shown below.
Vector Feature Counts
For layers of vector features the counts of features and grouped features are displayed in the layer metadata.
AREA COUNT, LINE COUNT, POINT COUNT, MESH COUNT - the number of features of a given type when each group is counted as 1 feature. If the layer contains only area features, the area count will match the feature count in the layer description displayed in the Control Center.
GEOMETRY COUNT - the count of all area features, irrespective of whether or not the feature is in a group. If there are deleted area features, the count will be included here in parentheses.
AREA GROUP COUNT - the total number of area, lines, points and meshes, irrespective of whether or not an area feature is in a group.
Additional
For online sources, the source webpage will be displayed on the Additional tab in the Metadata Window. The Projection can be imported, exported (.prj) or changed from the 'Projection' tab, as well.
Additional tabs will also display for metadata specified in scripting, files manually linked , or recognized files in the same folder as the loaded data. The following file names will be recognized and loaded as additional metadata tabs:
- C:\path\filename_metadata.xml
- C:\path\filename_metadata.txt
- C:\path\metadata.xml
- C:\path\metadata.txt
Where C:\path\represents the full path to the loaded data, and filename represents the name of the loaded geospatial file.
For example loading the file C:\data\properties.shp would recognize and load the following metadata files in additional tabs:
- C:\data\properties_metadata.xml
- C:\data\properties_metadata.txt
- C:\data\metadata.xml
- C:\data\metadata.txt
To manually link a metadata file to the layer, right-click on the layer in Control Center and go to Layer > Link External Metadata File. The linked XML or HTML file will show as a Additional tab and the link will be saved in the workspace.
Statistics
Lidar data will display an additional tab indicating the point cloud statistics. For more information see Lidar QC - Compare/ Adjust Elevations to Control Points
Histogram
The Histogram tab (below) creates a histogram for each band of the loaded data, or a single histogram for terrain data and other single band rasters.
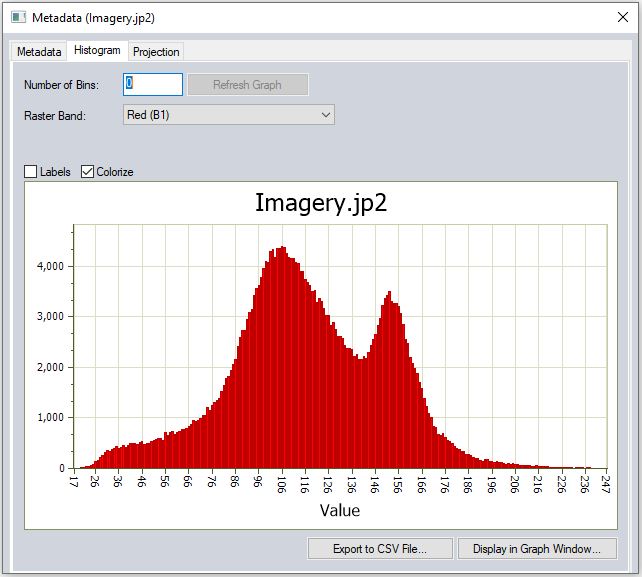
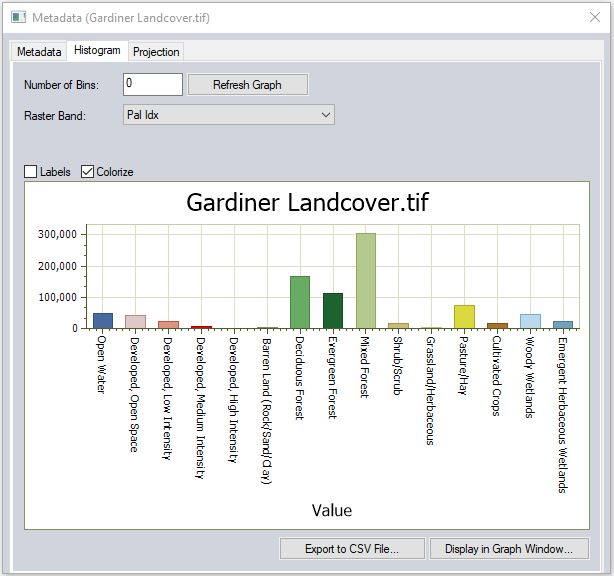
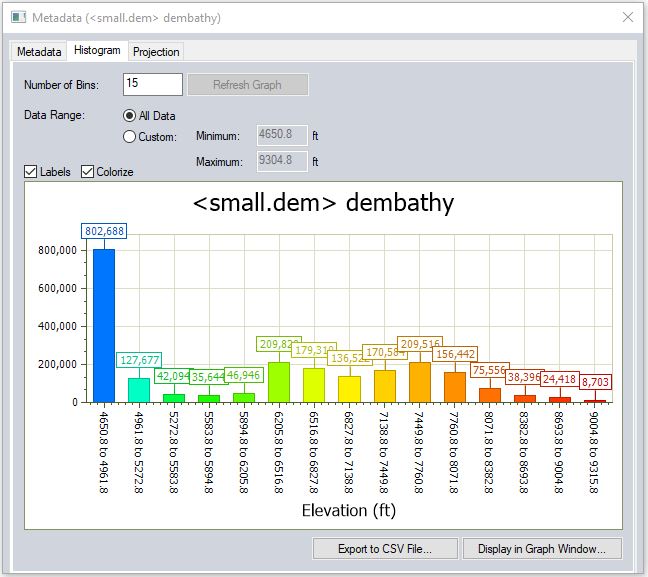
Click and drag the border of the window to increase or decrease the width of the Histogram display. Use the scroll wheel on your mouse to zoom in and out on the histogram.
Use Export to CSV File..., to create a CSV file using the data from the histogram. The exported CSV file will contain the axis label for each point, and the X and Y values. Histograms can also be generated using the Graph and Chart tools.
The histogram refresh will reflect cropping that has been done to the raster layers using the Cropping settings on the Layer options.
Labels - Check this option to display labels for each bar of the histogram.
Colorize - Use this option to colorize the histogram based on the data values. For terrain data the histogram will be colored using the active shader for the data.
Number of Bins
The Number of Bins may be increased or decreased, and the Histogram recalculated using the Refresh Graph option.
Band Selection
When the layer contains multiple bands, select which band to display the histogram for and press Refresh Graph to view the histogram for that band.
Data Range
When the layer contains terrain data, the Data Range settings allow for custom specification of the min and max for the X axis of the histogram. Choose to use all of the data or a custom data range. After typing in the minimum and maximum values for a custom range, click Refresh Graph to update the graph using the specified data range.
Projection
The projection tab displays the projection interpretation for the selected layer. The display of the data will automatically be reprojected to the map display projection. If GeoCalc mode is enabled this will be replaced with the GeoCalc projection tab. The projection is viewable but not editable from this window. To modify the projection interpretation of the layer go to Layer Options.