The Create Voronoi/ Theissen Diagram from Point Features command, found in the Vector Analysis menu, allows the user to analyze the loaded point features to create a Voronoi Diagram. A Voronoi diagram is a way of dividing space into a number of regions. A set of points (called seeds, sites, or generators) is specified beforehand and for each seed there will be a corresponding region consisting of all points closer to that seed than to any other. The regions are called Voronoi cells. Voronoi diagrams that are used in geophysics and meteorology to analyze spatially distributed data (such as rainfall measurements) are called Thiessen polygons.
When selected, the command displays the Voronoi/ Theissen Diagram Options dialog (pictured below) which allows the user to determine several aspects of the Voronoi diagram.
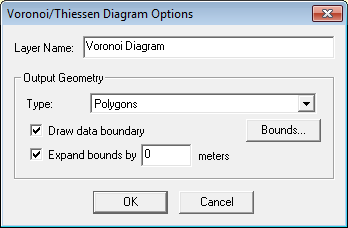
The user can specify the Layer Name to be used by the Voronoi diagram. In addition, in the Output Geometry section, the user can indicate whether the cells in the resulting Voronoi diagram should be made up of a collection of polygons or line segments, and check the Draw data boundary box to indicate whether or not the data boundary should be part of the output diagram. Seeds that lie on the boundary can be hard to see in a Voronoi diagram, so sometimes it makes sense to expand the boundary of the input data points. Check the Expand bounds by box to specify the distance to be added to the boundary length and width before creating the diagram.