The lidar toolbars available with Global Mapper Pro provides a number of tools for Quality Control of lidar point cloud data. This includes tools to compare or correct the height of point cloud data to known control points, and to report statistics about subsets of points. It also has tools for displaying and reporting the point cloud density, and for filtering the point cloud by density.
 Lidar QC - Compare/ Adjust Elevations to Control Points
The Lidar QC tool compares control points to nearby Lidar points. It can also use the control points to adjust the Lidar elevations to fit the control points.
|
|
This tool requires Global Mapper Pro |
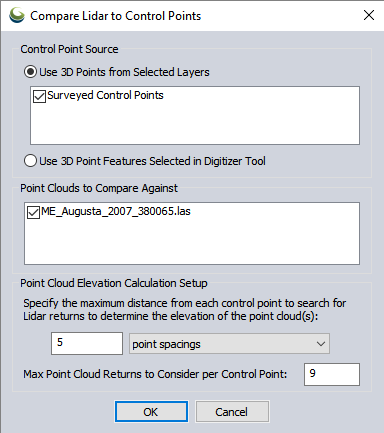
Control Point Source
Use 3D Points from Selected Layers- Specify the layer that contains the control points.
Use 3D Point Features Selected in Digitizer Tool - Select this option to only compare to pre-selected control points.
Point Clouds to Compare Against
Select which point clouds to check / adjust the elevations on.
Point Cloud Elevation Calculation Setup
Specify the maximum distance at which to search for Lidar points near the controls. By default, nearby Lidar points are defined as those within 5 point spacings, with a minimum nearby distance of .25 meters and a maximum of 5 meters.
Specify the Max Point Cloud Returns to Consider per Control Point. The default value is 9. The results dialog will calculate the difference between the control points and the point cloud, stopping the search after finding the max number of point cloud returns closest to each point.
The calculation uses Inverse Distance Weighting (IDW) of the control points to calculate the expected Z value of the nearby Lidar points. That means points in the cloud that are closer to the control have a greater influence on the calculated expected LIDAR_ELEV value at the location of the control point.
Lidar Control Point Match Information
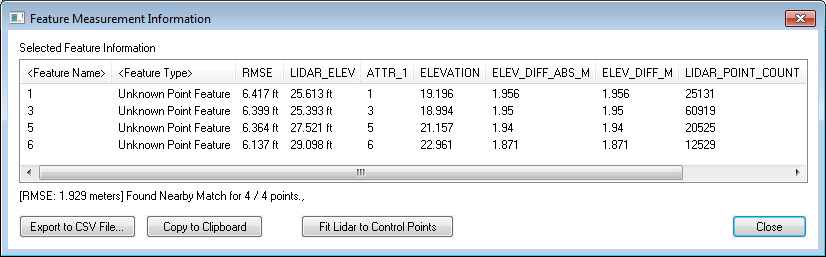
The tool will display a list of the input control points, with statistics comparing them to the nearby LiDAR points. The calculated statistics do not include Lidar points that have been filtered to be non visible.
Uncheck ground control points to exclude them from the RMSE statistics display, and best-fit calculation.
Statistics
RMSE - The root mean square error is a measure of the difference between the expected elevation from the control points, and the measured lidar values.
LIDAR_ELEV - Average elevation of the nearby lidar points
ELEV_DIFF_ABS_M - Absolute elevation difference between lidar and control points in meters.
ELEV_DIFF - Difference in elevation between Lidar and control points.
LIDAR_POINT_COUNT - The number of nearby Lidar points being compared to the control point. This is the number found within the maximum distance, capped at the Max Point Cloud Returns to Consider set in the initial dialog.
Overall RMSE is reported at the bottom of the dialog.
Found Nearby Match indicates the number of control points that had nearby Lidar points for comparison.
Export to CSV File
Select this option to save a CSV file of the Feature Information report. This will include the overall RMSE report and number of matches at the bottom.
Copy to Clipboard
Select this option to copy the Feature Information report to the windows clipboard to paste in a text editing application. This will be a comma separated list, including the overall RMSE report and number of matches at the bottom.
Fit Lidar to Control Points
Select the Fit Lidar to Control Points button to rectify the entire point cloud to match the control point elevations. This vertical rectification applies to the entire layer, including points that may be filtered to be non-visible.
Piecewise Affine - A piecewise-affine (triangulation) transform is applied. This results in an exact Z shift at each control point and an interpolated result in between, trailing off to zero far outside the points. This is the default method, and was the only method available before v26.0.
Fixed Z Shift - A fixed Z shift is applied to all points. The default value is the average ELEV_DIFF across all points.
Best Fit Plane - A best-fit 3D plane is calculated from the Z shift at each control point, and the cloud points are then adjusted from the Z plane values.
Additional LiDAR QA tools
Lidar Metadata and Statistics
In the control center, right click on the Lidar point cloud and choose metadata to see metadata as well as calculated statistics from the point cloud.
Metadata
Some of the available metadata values for point clouds include:
- Lidar Point Count - Total number of points in the point cloud. This is also listed after the feature description in the control center.
- Point Cloud Memory - The amount of memory used to load the point cloud. PREVIEW CLOUD is the memory of the point cloud subset used in drawing.
- Lidar Point Density - point samples per square meter.
- Lidar Point Spacing - Calculated average distance between Lidar points. This is calculated from the point cloud as a function of the overall point density. The point spacing value may be used in Auto-classification tools to determine optimal bin/ grid spacing.
- Lidar Offset, Lidar Scale - these properties are part of the file compression, so the full numeric values do not need to be stored for each point.
- Covered Area- calculate area of the bounding box containing the point cloud.
- Load Time - amount of time taken to load the file into memory. This does not include the time taken to draw or render the data.
- Min Elevation - the lowest elevation value.
- Max Elevation - the highest elevation value.
Statistics
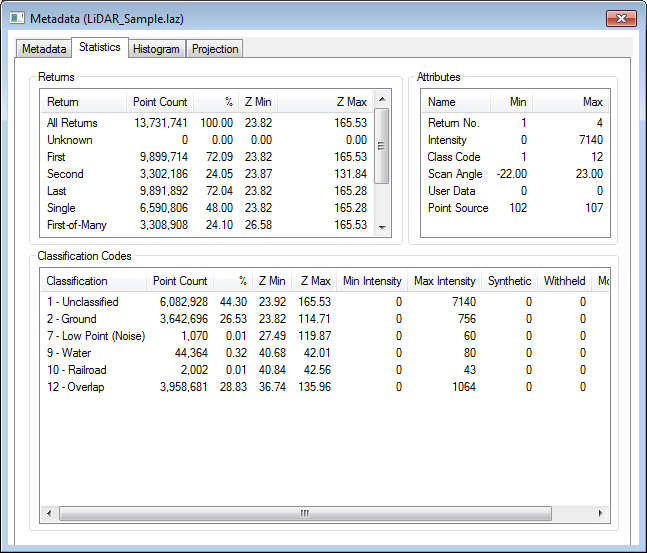
The statistics tab of the metadata dialog displays a summary of the Attributes, Return counts, and Classification Codes.
Calculate Lidar Statistics in Selected Area features
To see the statistics for a subset of points, select a area(s) with the digitizer tool. In the digitizer right-click context menu choose Analysis/Measurement > Calculate Lidar Statistics in Selected Area features. This will display a Lidar Dataset Properties window indicating a summary of the Returns, Attributes and Classification codes for the selected points.
Color Lidar by Point Density
Color points using calculated point density. The point density is calculated based on the full point cloud loaded in the layer. To visualize the point density for a particular classification, the subset of points must be loaded or copied to a new layer.
Filter Lidar data by Point Density, Scan Angle, Elevation, Height Above Ground
The Lidar advanced selection options can be applied to refine a selection of point features while editing with the Digitizer tool. The Lidar/Terrain Display Controls provide options to filter all loaded lidar points. The point density and height above ground values are calculated based on all points in the layer. Scan Angle and Elevation values are attributes of the point file.
Search and Query points
The Search Vector Data tool may be used to query Lidar data. With large point clouds, it is recommended to use the 'Search Onscreen Features Only' setting to limit the results to only visible points.
Report Statistics for Point Attributes
The Search Vector Data tool may be used to report statistics of numeric point attributes, by right clicking on a numeric value in the search results and choosing STATS- Report Statistics for Values of Attribute. The resulting dialog will include the Minimum, Maximum, Average, Standard Deviation, and Sum of the attribute values in that column, for the current listed search results.
Adjust Selected Lidar Towards Surface
This tool will update the position of Lidar points to align towards a surface or surface and trajectory file.
Fit Point Clouds
Automatically align point clouds calculating a best-fit adjustment, or manually align them using 3D ground control points.
Compare Point Clouds
Find significantly changed points between a set of point clouds covering the same area.
Smooth Selected Lidar Points
Adjust selected points towards an average of the nearby points to remove outliers.