 Creating
a Best-Fit Coordinate System
Creating
a Best-Fit Coordinate System
This tool is designed to relate a local coordinate system to a projected or geodetic system, by creating a Fitted Coordinate system![]() A local survey grid or engineering system paired with a polynomial transformation to relate the system to a known geodetic or projected system. The transformation may be calculated by minimizing the error for a set of control points that define coordinates in both the local system and a known system. using a set of control points.
A local survey grid or engineering system paired with a polynomial transformation to relate the system to a known geodetic or projected system. The transformation may be calculated by minimizing the error for a set of control points that define coordinates in both the local system and a known system. using a set of control points.
Note: This method
will create a new Fitted Coordinate system in the datasource. In order
to use the Best Fit functionality, the datasource object cannot be locked
by the administrator.
-
Create a new Point Database Best Fit Job by going to File>New>Job>Point Database Best Fit or by selecting the job from the Start Page and selecting 'Create Job'.
-
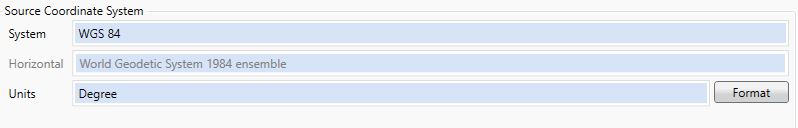
Once you have started a Point Database Best Fit, the left-hand coordinate system will be the Base Coordinate System, which is the system of your known control points (Transform points). The right system will be the new, Fitted Coordinate System. Clicking the System box in the Base Coordinate System section will allow you to Select your Input coordinate system (the system of your control points).
-
Load a point database file by clicking the Browse (...) button in the Input Data area at the top of the job window. You can load data into the table from a file, or from an ODBC database connection.
Note: The extension of any custom text file scheme that you have defined will appear within the file type filter list.
-
The right-hand system will by your new, Fitted Coordinate System. You can name the system you are creating and select a Point Style to select the units of your system.
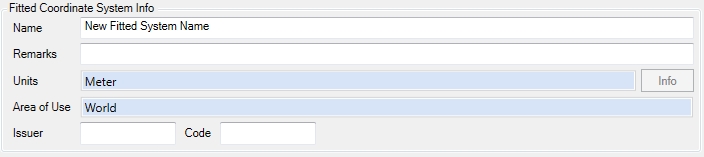
Note: Be certain that you select the correct point style. A mismatch of Angular or Linear units will have a tremendous effect on the accuracy of the fit.
-
Use the Format buttons to select the display format for your input and output coordinates. This is very important for angular units.
-
Use the Local Coordinate and Base Coordinate fields to select the columns that contain your local coordinates and your control coordinates.
Input Settings
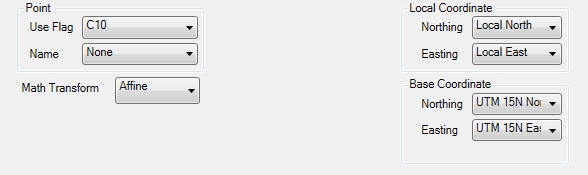
Local Coordinate: Original Northing / Original Easting - These values should point to the column containing the northing and easting of your local coordinate system.
Base Coordinate: Transform Northing/ Transform Easting - These values should point to the column containing the northing and easting (or latitude and longitude) of the known coordinate system.
Point Use Flag - - Click "Add New Column" to create a column containing a toggle box for each point. Points with checked boxes will be used in the Best Fit Transformation job. Points with unchecked boxes will be omitted from the operation.
Point Name - This is the column containing names of the reference points (optional). The point name will be used to identify the point on the Error Plot.
Math Transform - Select a Math Transform model to establish the fit. You must have enough control points for the model chosen. Supported models are:
- Affine:
(Linear Polynomial) Requires 3
control pairs
- Second-Order Polynomial:
(Quadratic Polynomial) Requires 6 control pairs
- Third-Order Polynomial:
(Cubic Polynomial) Requires 10 control pairs
- Fourth-Order Polynomial: (Quartic Polynomial)
Requires 15 control pairs
- Fifth-Order Polynomial: (Quintic Polynomial) Requires 21 control pairs
- 4 Parameter Helmert 3D: Requires 2 control pairs
For more information, see Polynomial Transformations.
Output Settings
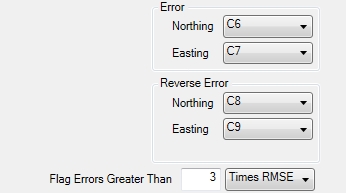
Error: Northing / Easting - These values point to the columns containing errors associated with the Best Fit transformation. They will be displayed in the error graph. You will want to add columns for each of these errors.
Reverse Error: Northing / Easting - These values point to the columns containing errors associated with the Best Fit transformation. They will be displayed in the error graph. You will want to add columns for each of these errors.
Flag Errors Greater Than - This value is used to highlight errors in the Best Fit Error Plot. Residual errors drawn on the error plot will be red by default if they are larger than the error flag value.
- Affine:
(Linear Polynomial) Requires 3
control pairs
-
Click the Process button to complete the Best-Fit. Clicking on the Error Plot tab at the top of job will display a graph showing the residual errors created in the Best Fit transformation process.
Error Plot
The Error Plot can be used to graphically assess the fit of individual points within the model. The relative locations of each control point will be displayed as a point. The vectors coming off the points are exaggerated by the factor shown at the bottom of the screen.
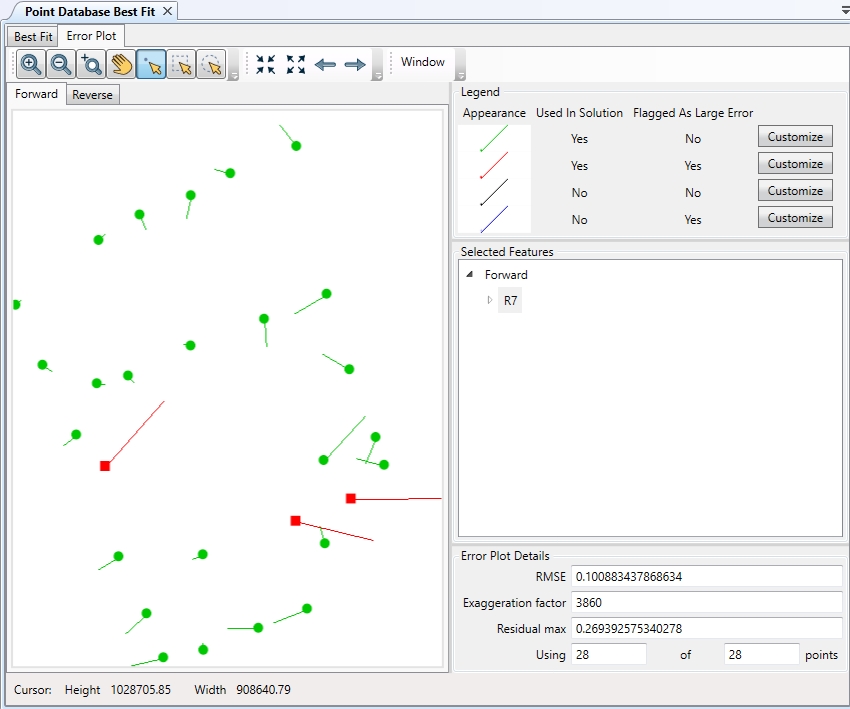
This is to assist you by drawing your attention to points that do not fit: the longer the vector, the worse the fit. To see the actual error associated with a point simply click on that point. The RMSE (Root Mean Square Error) is the overall accuracy of the fit based on the control points included in the fit.
-
If necessary, remove control pairs from the model by changing the value in the Point Use Flag column to a character other than 1. You can then click Calculate again, to generate a new fit. Repeat this as needed to adjust the fit model.
-
Organize your new fitted system by going to Datasource>Coordinate System Definitions. All new Fitted systems will be located at the top level of the Fitted Coordinate Systems category in the tree view. You can drag and drop individual definitions to an appropriate subcategory or create a new subcategory to put the systems in. When you close the dialog, be sure to click Save to save your changes or they will be lost when you close the Calculator.