Error Plot
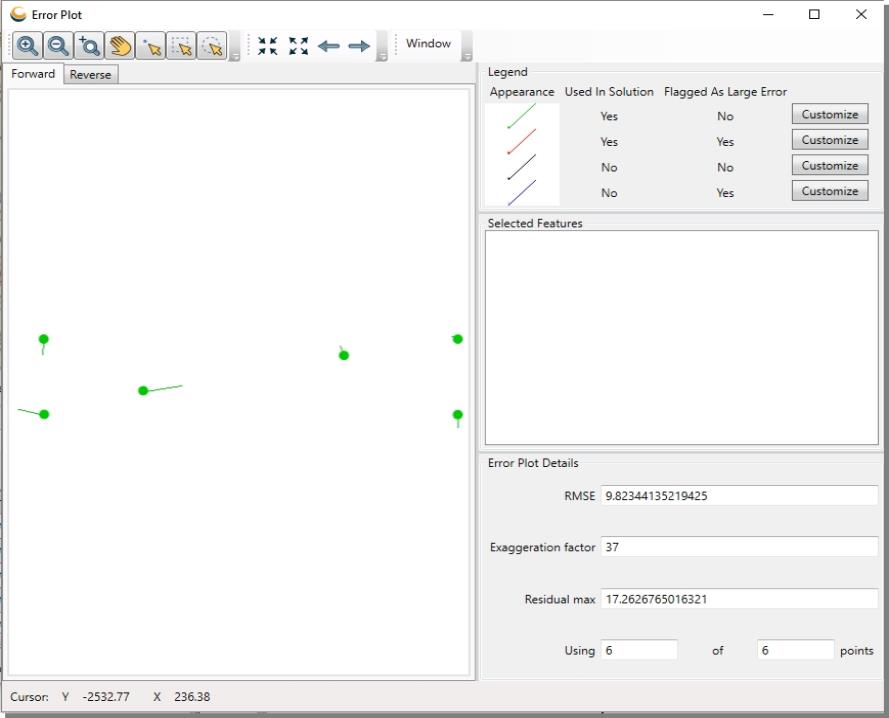
The error plot is used to graphically display the error vector for each of the control points specified for an image. The symbols represent the relative location of the pixel coordinates (in the Forward view) or the geographic coordinates (in the Reverse view). The vectors coming off the points represent the relative XY or East North error associated with each point. The vectors are exaggerated for display with the vector multiplied by the Exaggeration Factor that is displayed in the Error Plot Details in the Panel on the right. This coefficient will be automatically set by the display as a means of helping to quickly identify points with large errors. A point with a larger line has a larger error. Clicking on a point in the display will display all of the error information for that point in a popup.
Any points that have errors larger than 3 times the Root Mean Square Error (RMSE) will be highlighted in red and displayed as a square symbol. The RMSE is the average error for the entire reference model of the control points. A lower RMSE will result in a more accurately referenced image.