BSB Marine Chart
Loading BSB Marine Chart
Load a BSB Marine Chart by pointing to the *.KAP or *.CAP file. BSB Charts can also be loaded directly out of compressed folders (*.zip, etc.)
For seamless display of chart data, BSB charts support automatic collar (margin) removal, by going to the layer options and setting Automatically Crop Collar on the Cropping Tab.
Changing the Resampling method on the Display tab of the layer options to Bilinear Interpolation or Bicubic Interpolation may improve legibility of the text in the raster chart.
Export BSB Marine Chart
The Export BSB Marine Chart command allows the user to export any loaded raster, vector, and elevation grid data sets to a palette-based (up to 127 colors) BSB marine chart raster image for use in compatible applications and some marine chart plotters. The export will generate a single KAP file containing the chart image.
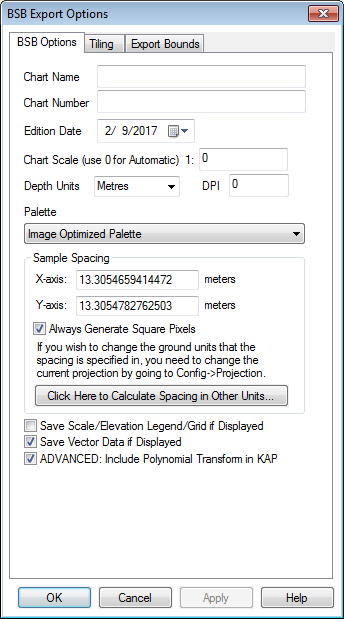
When selected, the command displays the BSB Export Options dialog which allows the user to setup the export. The dialog consists of a General options panel which allows the user to set up the pixel spacing and chart parameters, a Tiling Panel, and an Export Bounds panel which allows the user to set up the portion of the loaded data they wish to export.
BSB Options
Metadata and Parameters
Chart Name
Specify the chart name to be included in the metadata
Chart Number
Specify the chart number to be included in the metadata
Edition Date
Specify the edition date for the raster chart
Chart Scale
Specify the chart scale. Use 0 to automatically determine the scale based on the sample spacing and image size.
Depth Units
Specify the depth and height units
DPI
Specify the dots per inch of the image.
Palette
Specify the color palette to use in the chart.
The palette generated will be an optimal mix of up to 256 colors that will closely represent the full blend of colors in the source images. This option will generate the best results, but can more than double the export time required if any high color images are present in the export set. If all of the input data is palette-based and the combined palette of those files has 256 colors or less, then the combined files of the input file will just be used with no additional export time being required.
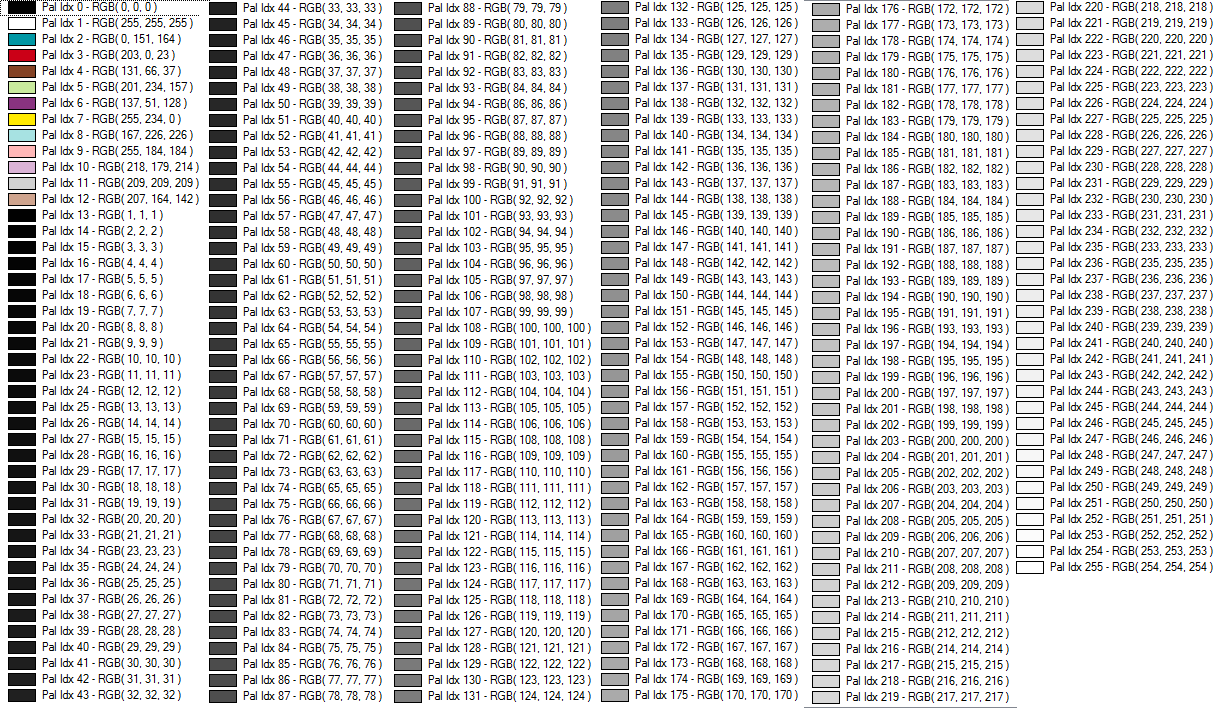
This palette consists of 256 scales of gray ranging from black to white.
This palette is optimized for the exporting USGS DRG data. The palette consists of only the standard DRG colors.

As the name suggests, this palette is optimized for exporting a mixture of USGS DRG data and grayscale satellite photos (i.e. USGS DOQs). The palette consists of the 14 standard DRG colors with the remaining 242 colors being a range of gray values ranging from black to white.
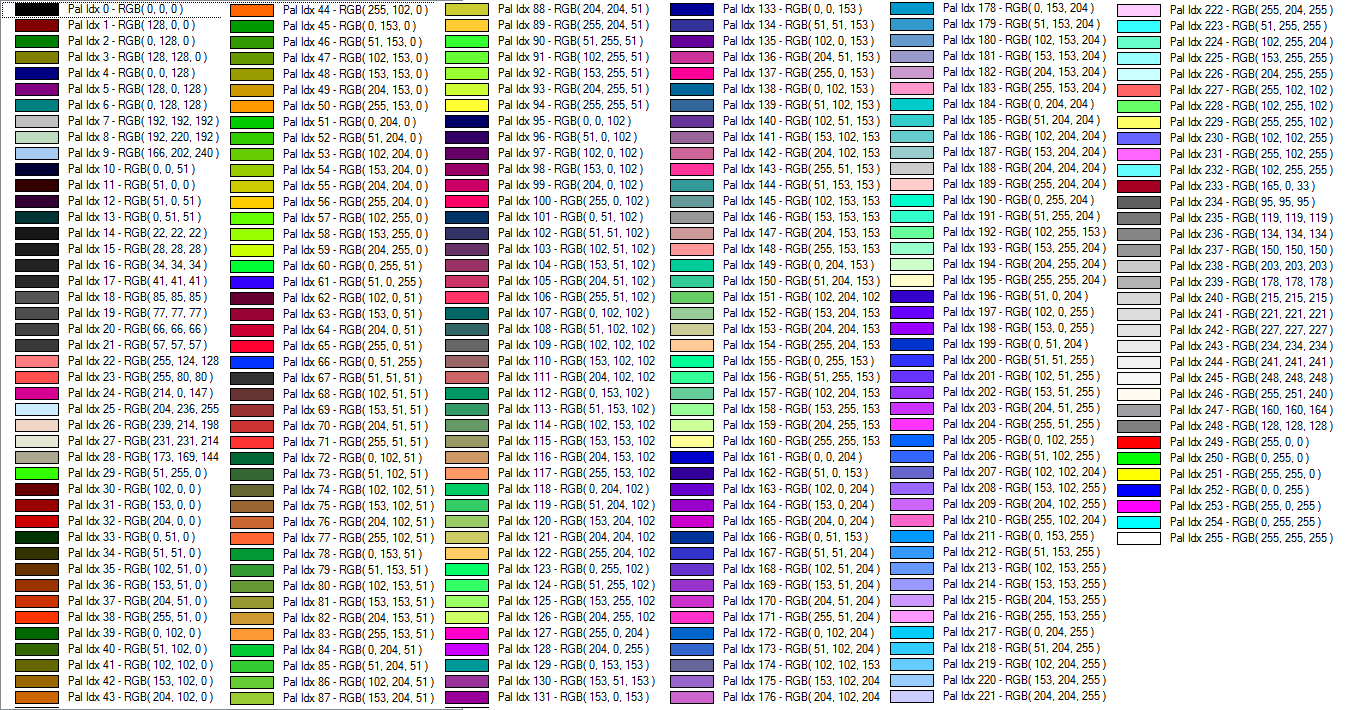
The palette consists of a blend of 256 colors evenly covering the color spectrum. This palette is the best choice when exporting anything but DRGs and grayscale satellite photos.
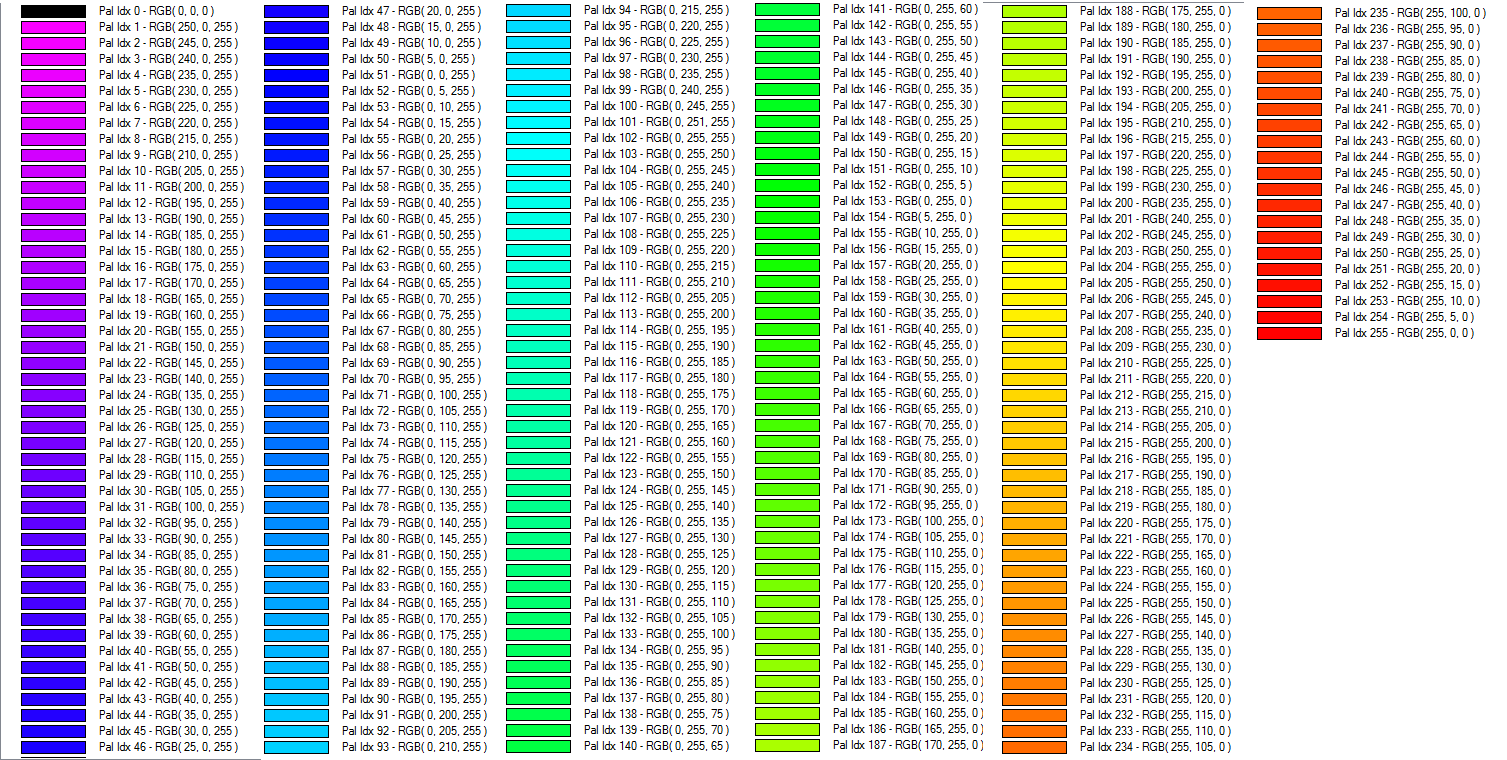
The spectrum palette consists of 256 saturated colors ranging from magenta to red. The palette goes through various shades with full 255 values for Red, Green, and then Blue successively, varying the other shades.
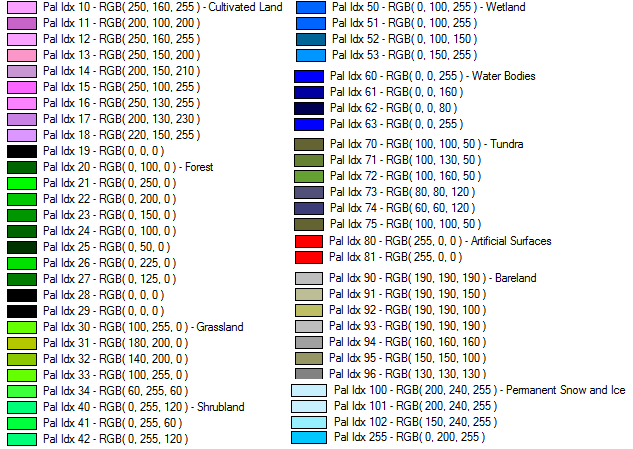
Palette for the USGS National Land Cover Database. For more information see https://www.mrlc.gov/

Palette from the Pan-European CORINE Landcover database . For more information see https://land.copernicus.eu/pan-european/corine-land-cover


This palette comes from the GlobeLand30 land cover database. For more information see https://www.globallandcover.com/
European Space Agency Climate Change Initiative Land Cover. For more information see www.esa-landcover-cci.org

This option allows the user to choose a .pal file describing the palette to use for the export. A .pal file should be a text file with one line per color, with the red, green, and blue color components for each color in the palette separated by a comma. A .pal file for an existing palette-based file can be saved by opening the Control Center, selecting the palette-based layer, Options, Transparent Color button, then selecting the option to save a color palette file.
This palette creates an 8-bit per pixel grayscale image with no color map stored in the image. Black will be stored as zero with varying shades of gray up to white with a value of 255.
This palette creates an 8-bit per pixel grayscale image with no color map stored in the image. White will be stored as zero with varying shades of gray up to black with a value of 255.
When converting from an existing palette image, the new image will be assigned the palette index (PAX IDX) of the closest matching RGB value in the new palette.
Sample Spacing
The Sample Spacing section allows the user to select the grid spacing to use when generating the file. The default value is the average of the grid spacings of all the currently loaded raster and elevation overlays.
If the Always Generate Square Pixels option is checked, the smaller of the specified x and y resolutions will be used for both the x and y resolution.
Selecting Always Generate Square Pixels ensures that the resultant image file will look good even in software that is not able to deal with pixels that aren't square.
To specify the spacing in units other than those of the currently selected view/ export projection, press the Click Here to Calculate Spacing in Other Units button.
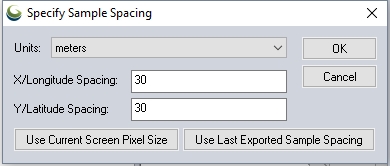
Specify the X and Y spacing of the output pixels in any of the selected units. These pixel dimensions will be translated into the units of the display projection during export. The Use Current Screen Pixel Size button will update the X and Y values to the dimensions of the map display. Use Last Exported Sample Spacing will update the X and Y values to the most recent export resolution.
Additional Options
Save Scale/Elevation Legend/ Grid if Displayed
Check this option to include displayed map elements in the export. These are enabled from Configuration Display Options
Save Vector Data if Displayed
ADVANCED: Include Polynomial Transform in KAP
Geographic Coordinates can be converted to pixel coordinates using polynomials. This is a high accuracy transformation method that not all chart reading programs utilize. The image position is the alternative spatial locating method. Check this option to include the polynomial transformation in the KAP file
Format Updates
Below is a summary of recent changes to BSB format support:
| 17.2 | Added option to BSB export to allow disabling the inclusion of polynomial conversions to the exported KAP files as some software cant handle them. The batch conversion also includes this option as well as scripting via the INC_POLYNOMIALS parameter for EXPORT_RASTER. [Item #17318] |
| 16.2 | Added support for reading and writing Polar Stereographic and Gnomonic projections from/ to BSB charts. [Item #15383] |
| 15.2 | Create BSB file alongside KAP when exporting to the BSB chart format. In scripts you can disable this by adding CREATE_BSB_FILE=NO to the EXPORT_RASTER command. |
| 15.1 | Updated BSB export to add dimmed palettes for dusk and night display. |
| 15.0 | Updated BSB exports from a single layer with an automatic crop boundary to save that in the exported KAP file’s PLY entries rather than the full export bounds to allow seamless viewing in other applications. |
| 14.2 | Greatly sped up the display of some rotated BSB charts. |
| 13.1 | Added support for BSB export with EXPORT_RASTER script command. |
| 13.1 | Added support for exporting BSB maps natively with the Transverse Mercator projection. |
| 12.1 | Added support for exporting loaded data to BSB Marine Chart format files. |
| 12.0 | Added support for decoding Transverse Mercator projections from BSB files. |
| 11.2 | Added support for loading NV Verlag encrypted marine charts (EAB/BSB format). |